Sentient Records: Engraving the Emotions and Sounds of the City with Brainwaves
Shiyu Qiu
Project Description
Have you ever wondered what it would sound like if our brain activity could be turned into music? In a city as vibrant yet stressful as New York, at every street corner, at every moment, our brains are emitting their own melodies. How different would the music of our brains be when strolling on a busy commercial street compared to navigating through a noisy subway?
These questions led me to explore how to convert our brainwaves into music, creating a new perspective on how we interact with our surroundings. In my daily urban life, I often feel a direct impact of the surrounding environment on my emotions. This sensation made me curious: Can we quantify this impact from a scientific perspective?
From Data to Insight
In my study, I investigated the influence of New York's diverse environments on emotions by collecting data across the city, including Times Square, Central Park, and its public transit systems. Using an advanced EEG headband, I monitored five major brainwave types in real-time while recording my experiences with a GoPro camera and tracking my location via GPS. This setup allowed me to correlate brainwave activity with my movements and visual inputs. To systematically analyze the impact on my emotions, I developed a questionnaire to assess emotional responses in each scenario, linking objective brainwave data with subjective experiences.
At the heart of this study is the detailed processing and analysis of EEG data, starting with filtering and normalization for accuracy, followed by conversion into time-frequency maps using specialized tools. For example, in busy commercial areas, Beta waves increase, indicating heightened alertness, and occasional Gamma wave spikes suggest complex cognitive responses, like noticing something new. This contrasts with serene places like Central Park, where Alpha wave dominance suggests deep relaxation.
I've developed a bubble chart to correlate specific urban emotions with brainwave patterns. Larger bubbles indicate stronger correlations. For instance, Delta waves show little association with curiosity or anxiety, typically linked to Beta and Gamma waves. Theta waves align closely with calm and happiness in quiet settings. Alpha waves are strongly connected to satisfaction and peace, distinct from the stress and excitement of urban life. This color-coded visualization captures the emotional landscape of city living.
Next, These charts not only show how the brain reacts to different urban settings but also provide insights into the emotional nuances behind these reactions, illustrating the complex interplay between environment and brain activity. In busy commercial streets, Beta and Gamma waves were notably active, making up 41% and 40.4% of the activity, respectively. This reflects the brain's need to respond rapidly to dynamic surroundings, which contributes to a high state of alertness and possibly explains the feelings of anxiety and curiosity common in such bustling environments.
In contrast, in calm residential areas, Theta and Alpha waves predominate. This suggests a relaxed and satisfied state, facilitated by the tranquil environment that allows for deep relaxation. Similarly, different patterns emerge in subways and churches. In the subway, high Beta waves indicate tension and anxiety. In contrast, in churches, there is a significant presence of Alpha and Theta waves, which correlate with states of prayer and spiritual contemplation, fostering calm and reflection.
Why Translating to Music
In my project, I'm not just recording and analyzing. I also aim to make the highly technical information of EEG data more intuitive and understandable, allowing audiences to perceive complex brain activities through auditory and visual experiences.
Brainwave Music Composition Process
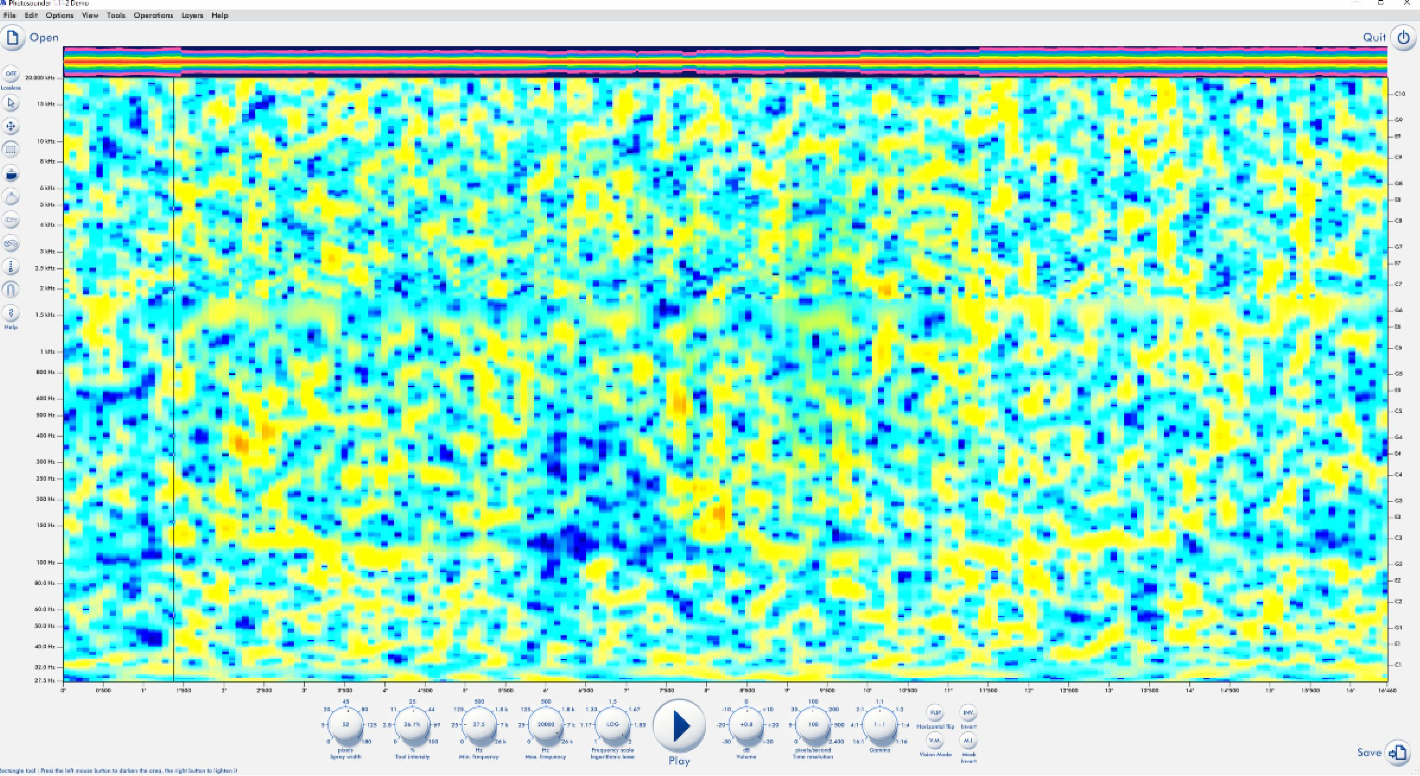
In my initial explorations, I noticed some correlation between brain frequency maps and audio spectrums, so I attempted to directly decode the brain frequency maps into sound using music software. However, this approach failed, producing what was mostly incomprehensible "noise." This experience made me realize that to create more meaningful and perceivable sounds, a more detailed analysis and mapping of the fundamental elements of brainwaves and sounds were necessary.
First, I explored the relationship between brainwave frequency bands and sound frequencies.
- Delta waves (0.5–4 Hz) - These are very low-frequency brainwaves, mapped to very low musical pitches, using notes like C0 and C1.
- Theta waves (4–7 Hz) - Mapped to slightly higher but still low audible bass notes, from C2 to E2.
- Alpha waves (8–12 Hz) - Mapped to mid-low range notes, from G2 to C3, which typically produce soothing and calming effects.
- Beta waves (12–30 Hz) - Beta waves are mapped to mid-to-high range notes, from E4 to B5. This range can represent focused attention and active mental engagement, creating rhythmically engaging melodies.
- Gamma waves (30–100 Hz) - Gamma waves are mapped to higher audio ranges, starting from C6, typically used to represent advanced cognitive activities. These notes can create bright, clear tonalities.
Next, I considered the correspondence between brainwave amplitude and sound amplitude, converting lower brainwave amplitudes into soft volumes to convey calm or relaxed emotional states, while higher brainwave amplitudes correspond to louder volumes, expressing excitement or tension.
The complexity of the waveform is also used to map the texture of the sound. For instance, simple brainwave activities are represented with clear sine waves, while complex or rapidly changing brainwave activities are expressed through sawtooth or square waves to depict rich layers of sound. Moreover, the dynamic changes in brainwaves are represented through sound envelopes; smooth brainwave changes produce soothing sound effects, while rapid changes create dramatic sonic impacts. Finally, interactions between different brainwave bands are transformed into complex harmonic structures, enriching the sound's detail and depth.
Through this detailed deconstruction and translation, I have transformed the originally abstract brainwave data into sound elements rich in emotional and cognitive significance.
How to Generate Music: Rule---Code---Music
How can someone like me, with no music composition experience, transform these into music? I used Sonic Pi, a magical tool that converts code into music. For example, using my coding rules, I utilized brainwave frequencies to set note pitches, amplitudes to adjust volumes, and waveform characteristics to select timbres. This method allowed me to program each EEG data element into music that conveys the emotional ambiance of various urban scenes.
I aimed to visually manifest my brainwave music. By extracting features like frequency, I incorporated these into the record's design. The proximity to the center indicates the range from low to high brainwave frequencies, and colors denote emotions, enabling auditory and visual comprehension of my brainwaves.
Finally, Showing one of the videos:
Album preview examples:
Feel free to put on your headphones and enjoy the immersive listening experience.
Click here to view more video recordings from the Sentient Records series 1
Click here to view more video recordings from the Sentient Records series 2
Click here to view more video recordings from the Sentient Records series 3
I've designed the record for clarity. Five brainwave types range from low-frequency Delta (0.5-4 Hz) to high-frequency Gamma (>30 Hz), depicted by their proximity to the record's center. The central area indicates low frequencies, while outward lines show the brainwave spectrum's spread. Line length reflects frequency strength, with longer lines indicating more intense brainwaves, representing states like excitement or focus. The line brightness and color variations highlight dominant frequencies and emotions specific to different urban scenes.
Viewers can discern major brainwave patterns directly from the record. For example, dominant Beta waves (12-30 Hz) in bustling areas signal high alertness, and spots in the Gamma range may indicate encounters with novel stimuli. In residential areas, prevalent Alpha waves (8-12 Hz) suggest relaxation, and Theta waves denote deeper contentment, like enjoying brief social interactions. Changes in brainwaves from activities like biking are also depicted, whether cruising smoothly or navigating crossings.
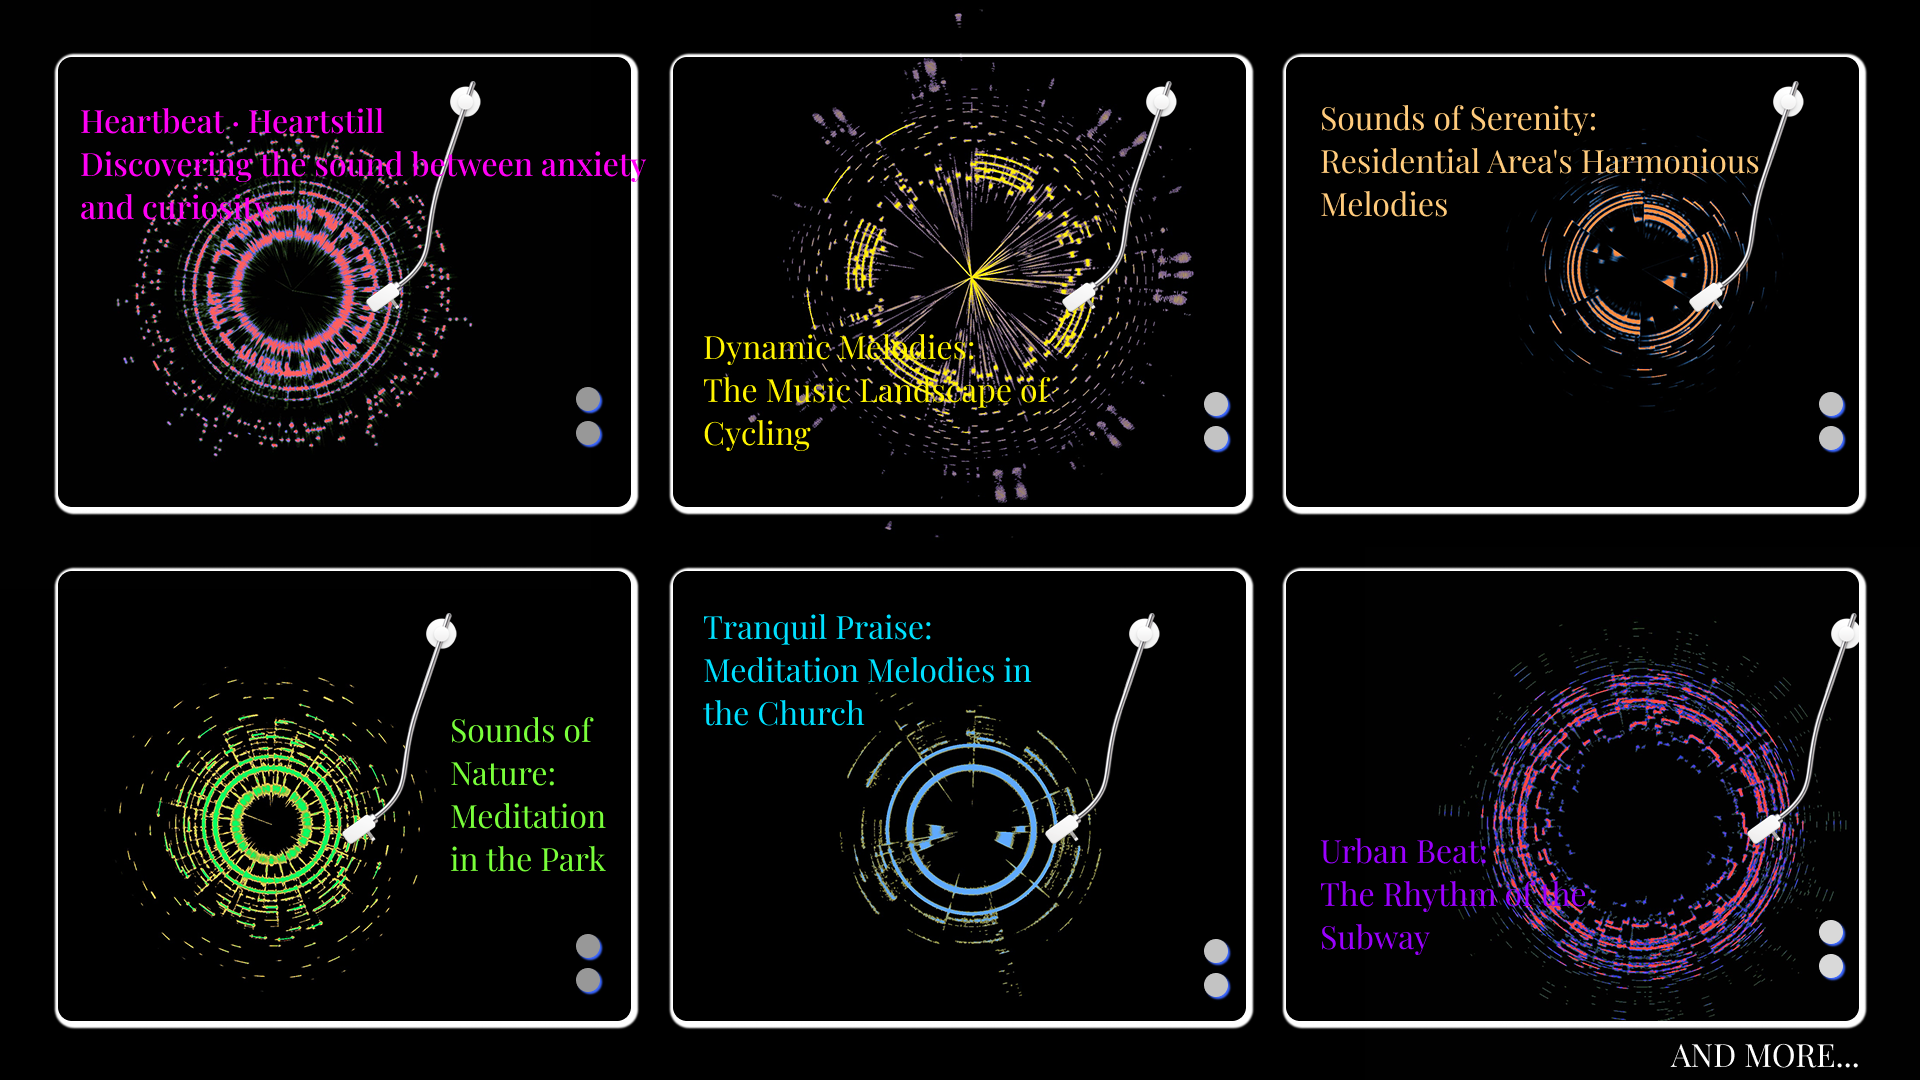
These pieces are auditory and artistic, akin to vinyl records, each representing brainwave frequencies from six different city scenes, capturing the city's pulse at those moments.
This project not only sheds light on how urban settings affect human emotions but also opens new paths for the artistic rendering of scientific data. Looking ahead, I aim to expand this method to fields like mental health research or urban planning, offering deeper insights and practical solutions.