Remote Sensing
Matthew Heaton
To a geographer, the internet is a challenging object of inquiry. The web flattens the intuitive experience of space while its users and constituent parts still have a measurable position in the real world. My capstone project attempts to parse this dissonance by asking: How can we measure digital connectivity as it relates to a physical world? Where are the furthest corners of and from the internet? How can sound be wielded as an alternative semiology to spatially represent signal, loss, noise, and other mechanisms that determine digital access?
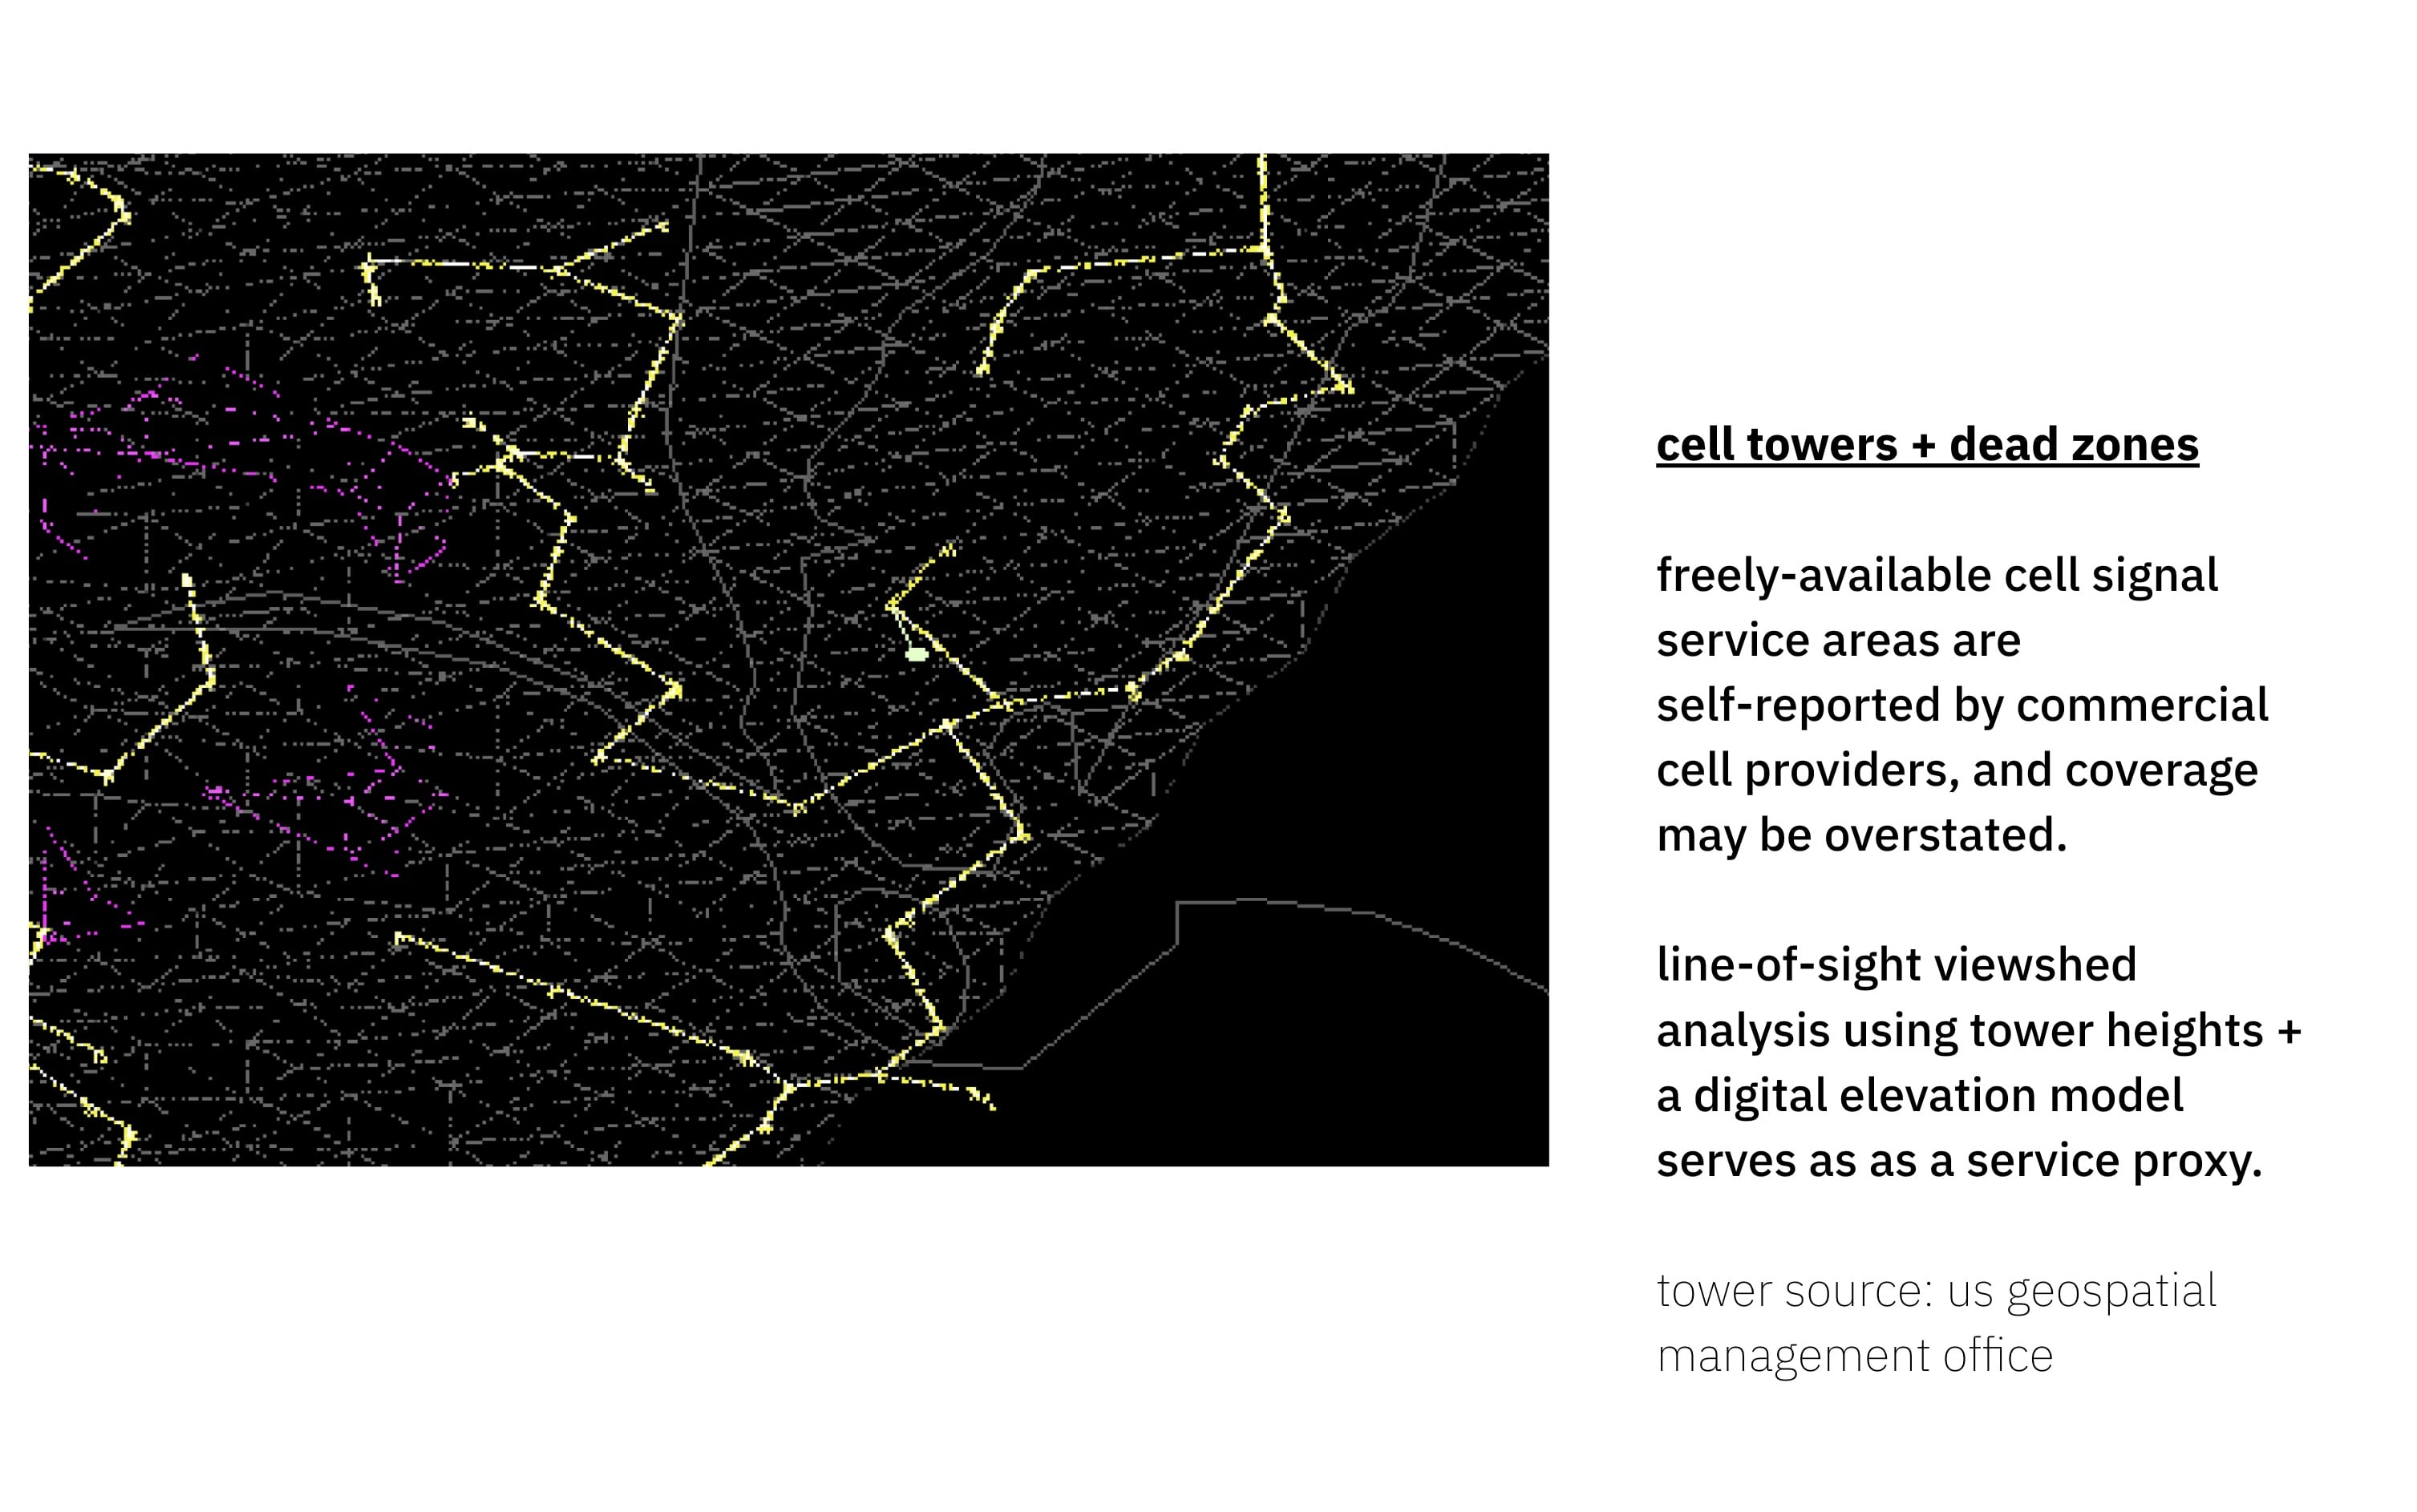
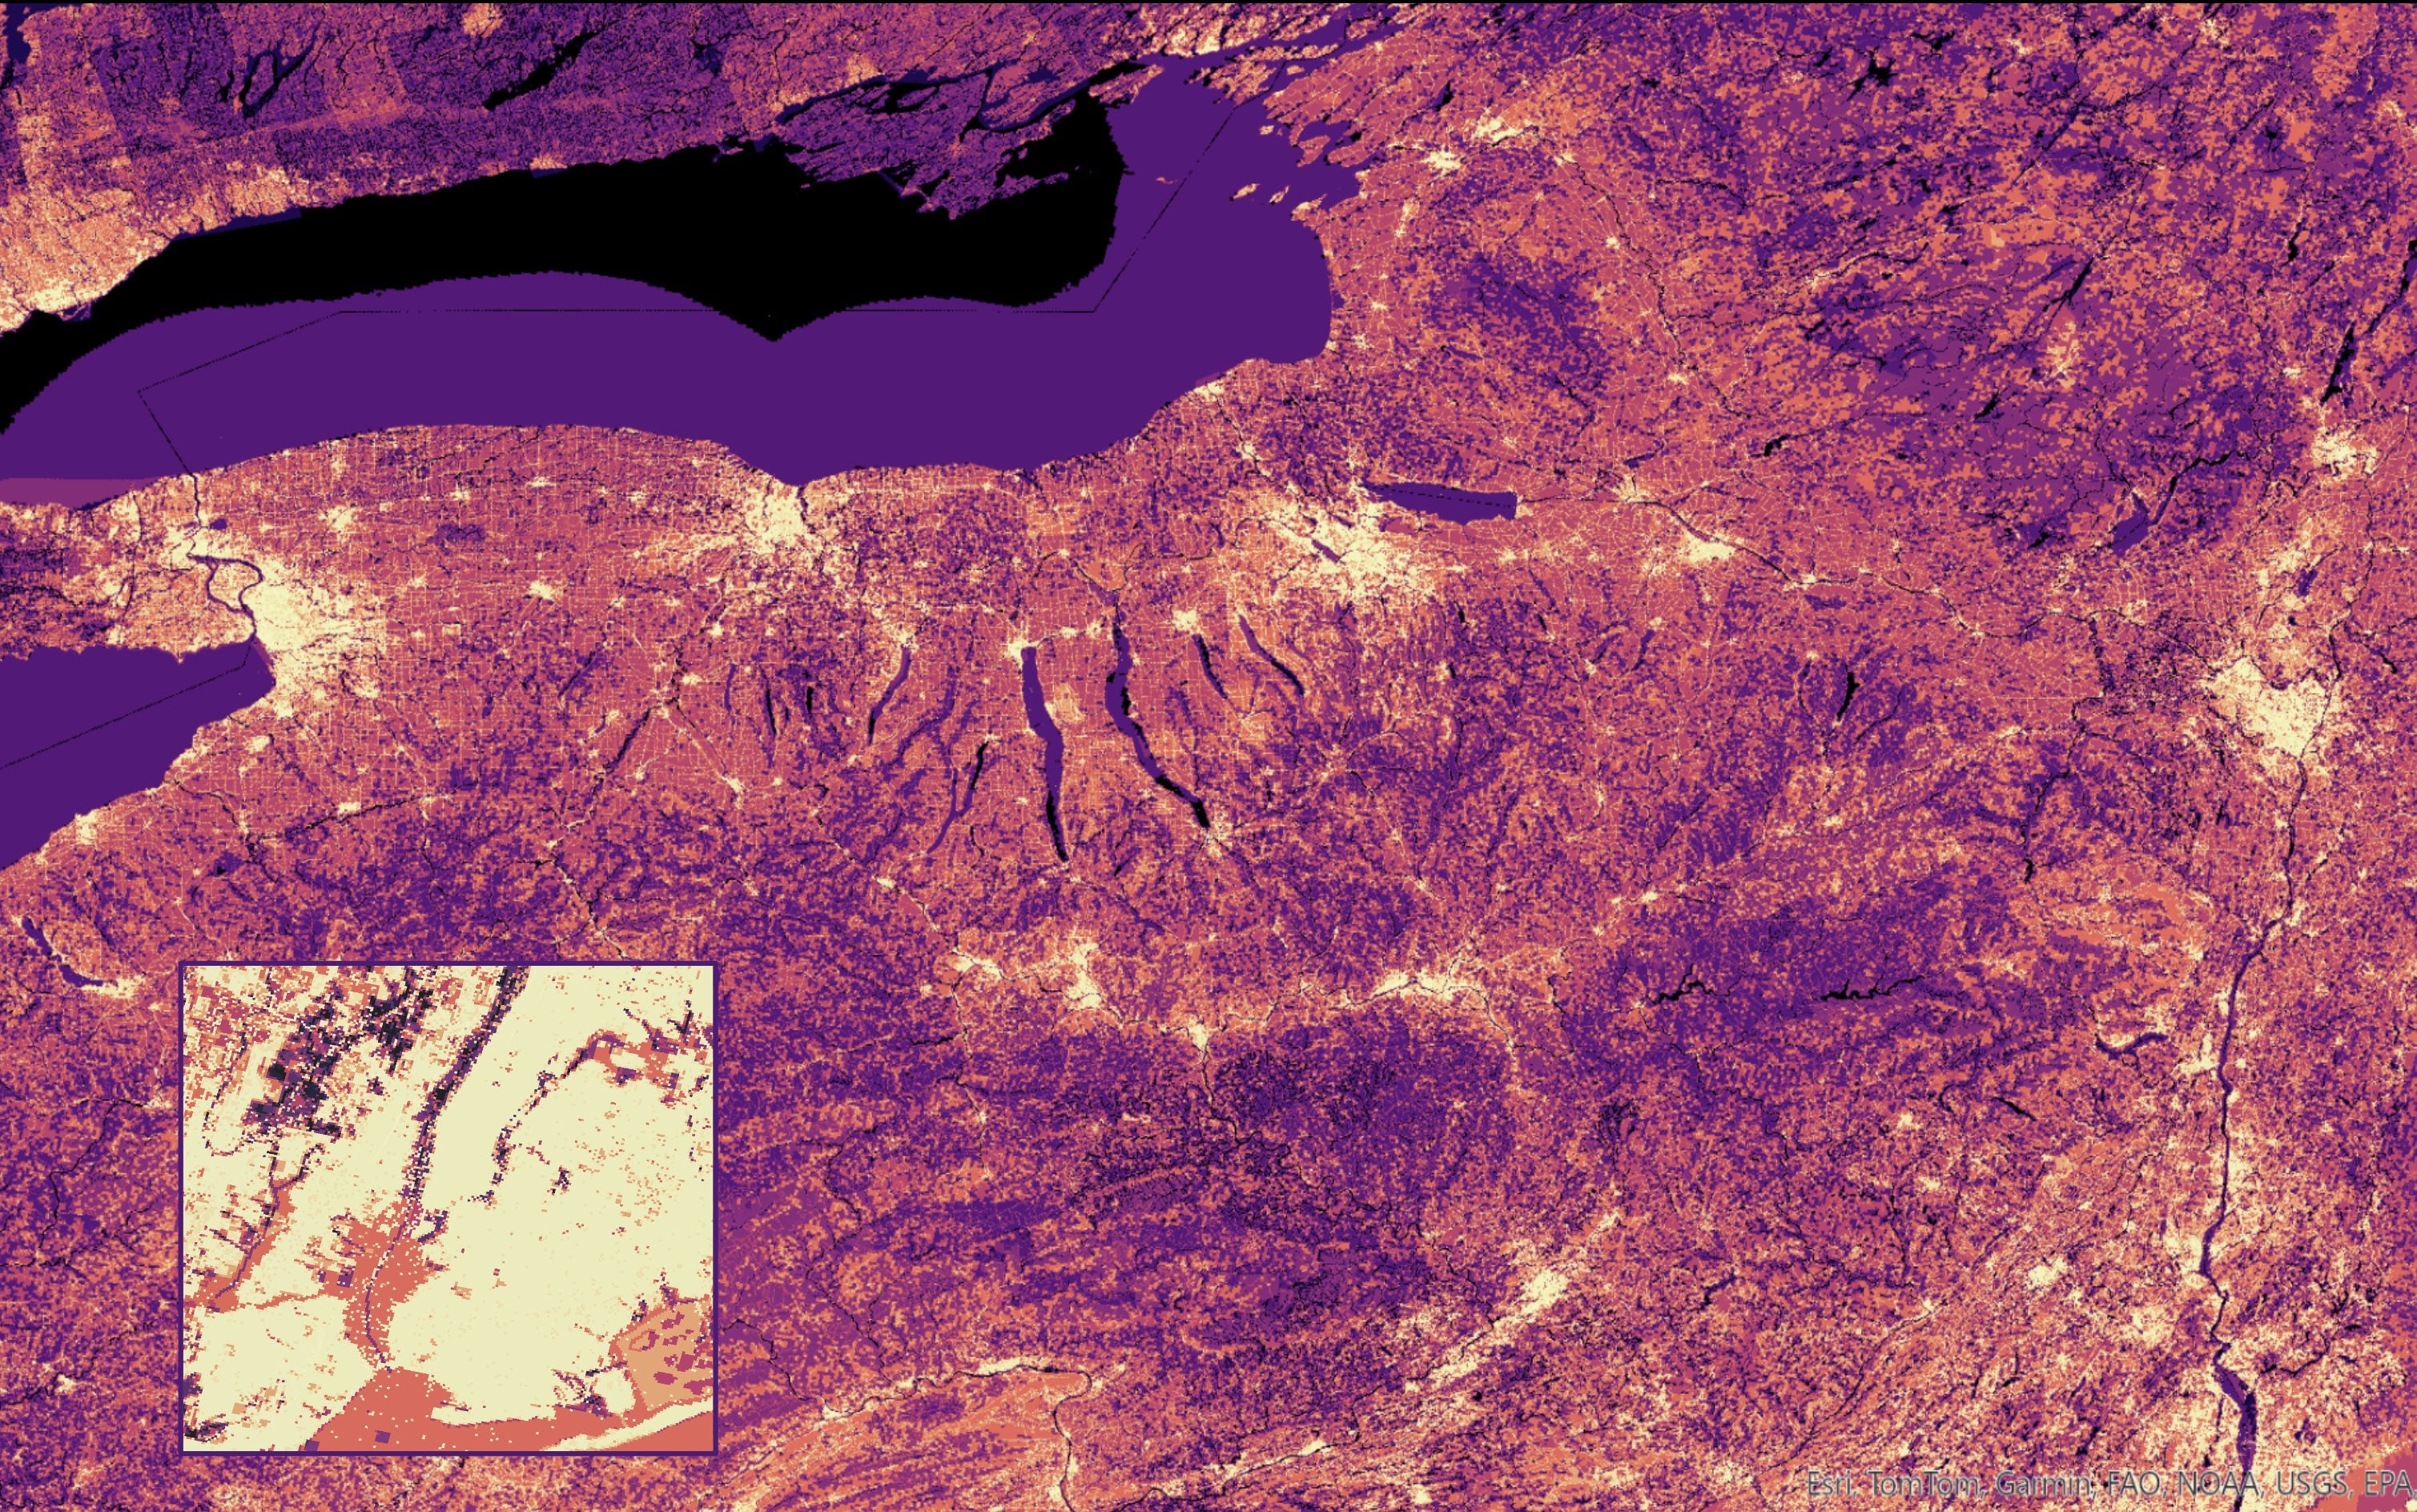
Typical maps of internet present a network configuration of nodes and edges (or portals and linkages) that define its virtual quote-unquote “space.” This type of spatiality is defined more through an amorphous, metaphorical cardinality than geographic positions or a felt humanistic experience. As a geographer, I prefer to think about topology more literally. Rather than confining my project to a virtual world-space, I’m directing my attention to the irl infrastructure that enables the virtual in the first place. This infrastructure - radio and cell towers, power lines, server farms, satellite constellations - all-too-easily slips into the background of the built environment, but inventorying these building blocks of remote communication provides vital insight into the physical contours of the internet. In particular, I am interested in the negative spaces in this map: the "noise" that obscures signal.
When using a receiver, one can surf channels not just with a frequency tuner but with their very traversal through space. Nuances of landscape and context manifest through these noise-to-signal ratios. Tones and timbres of decoded waves from a universe of noise mutate endlessly depending on one’s position and orientation.

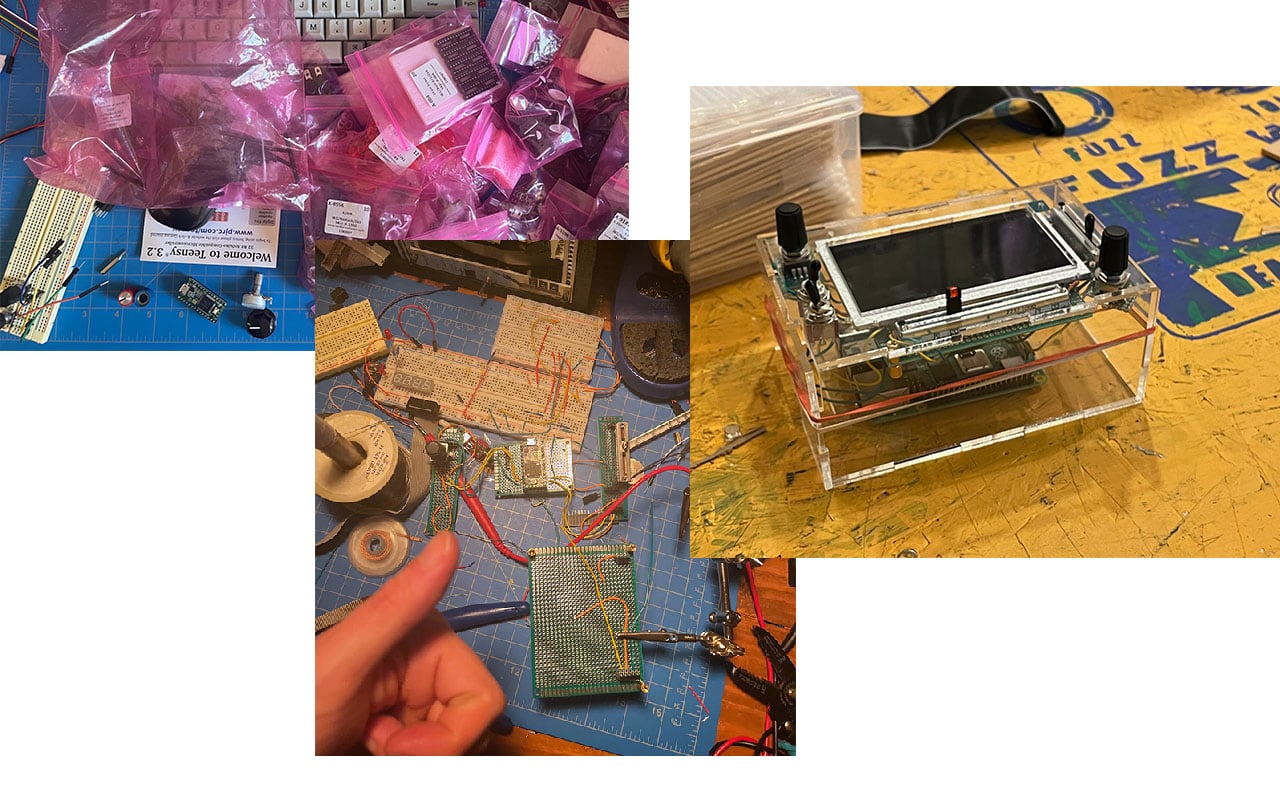
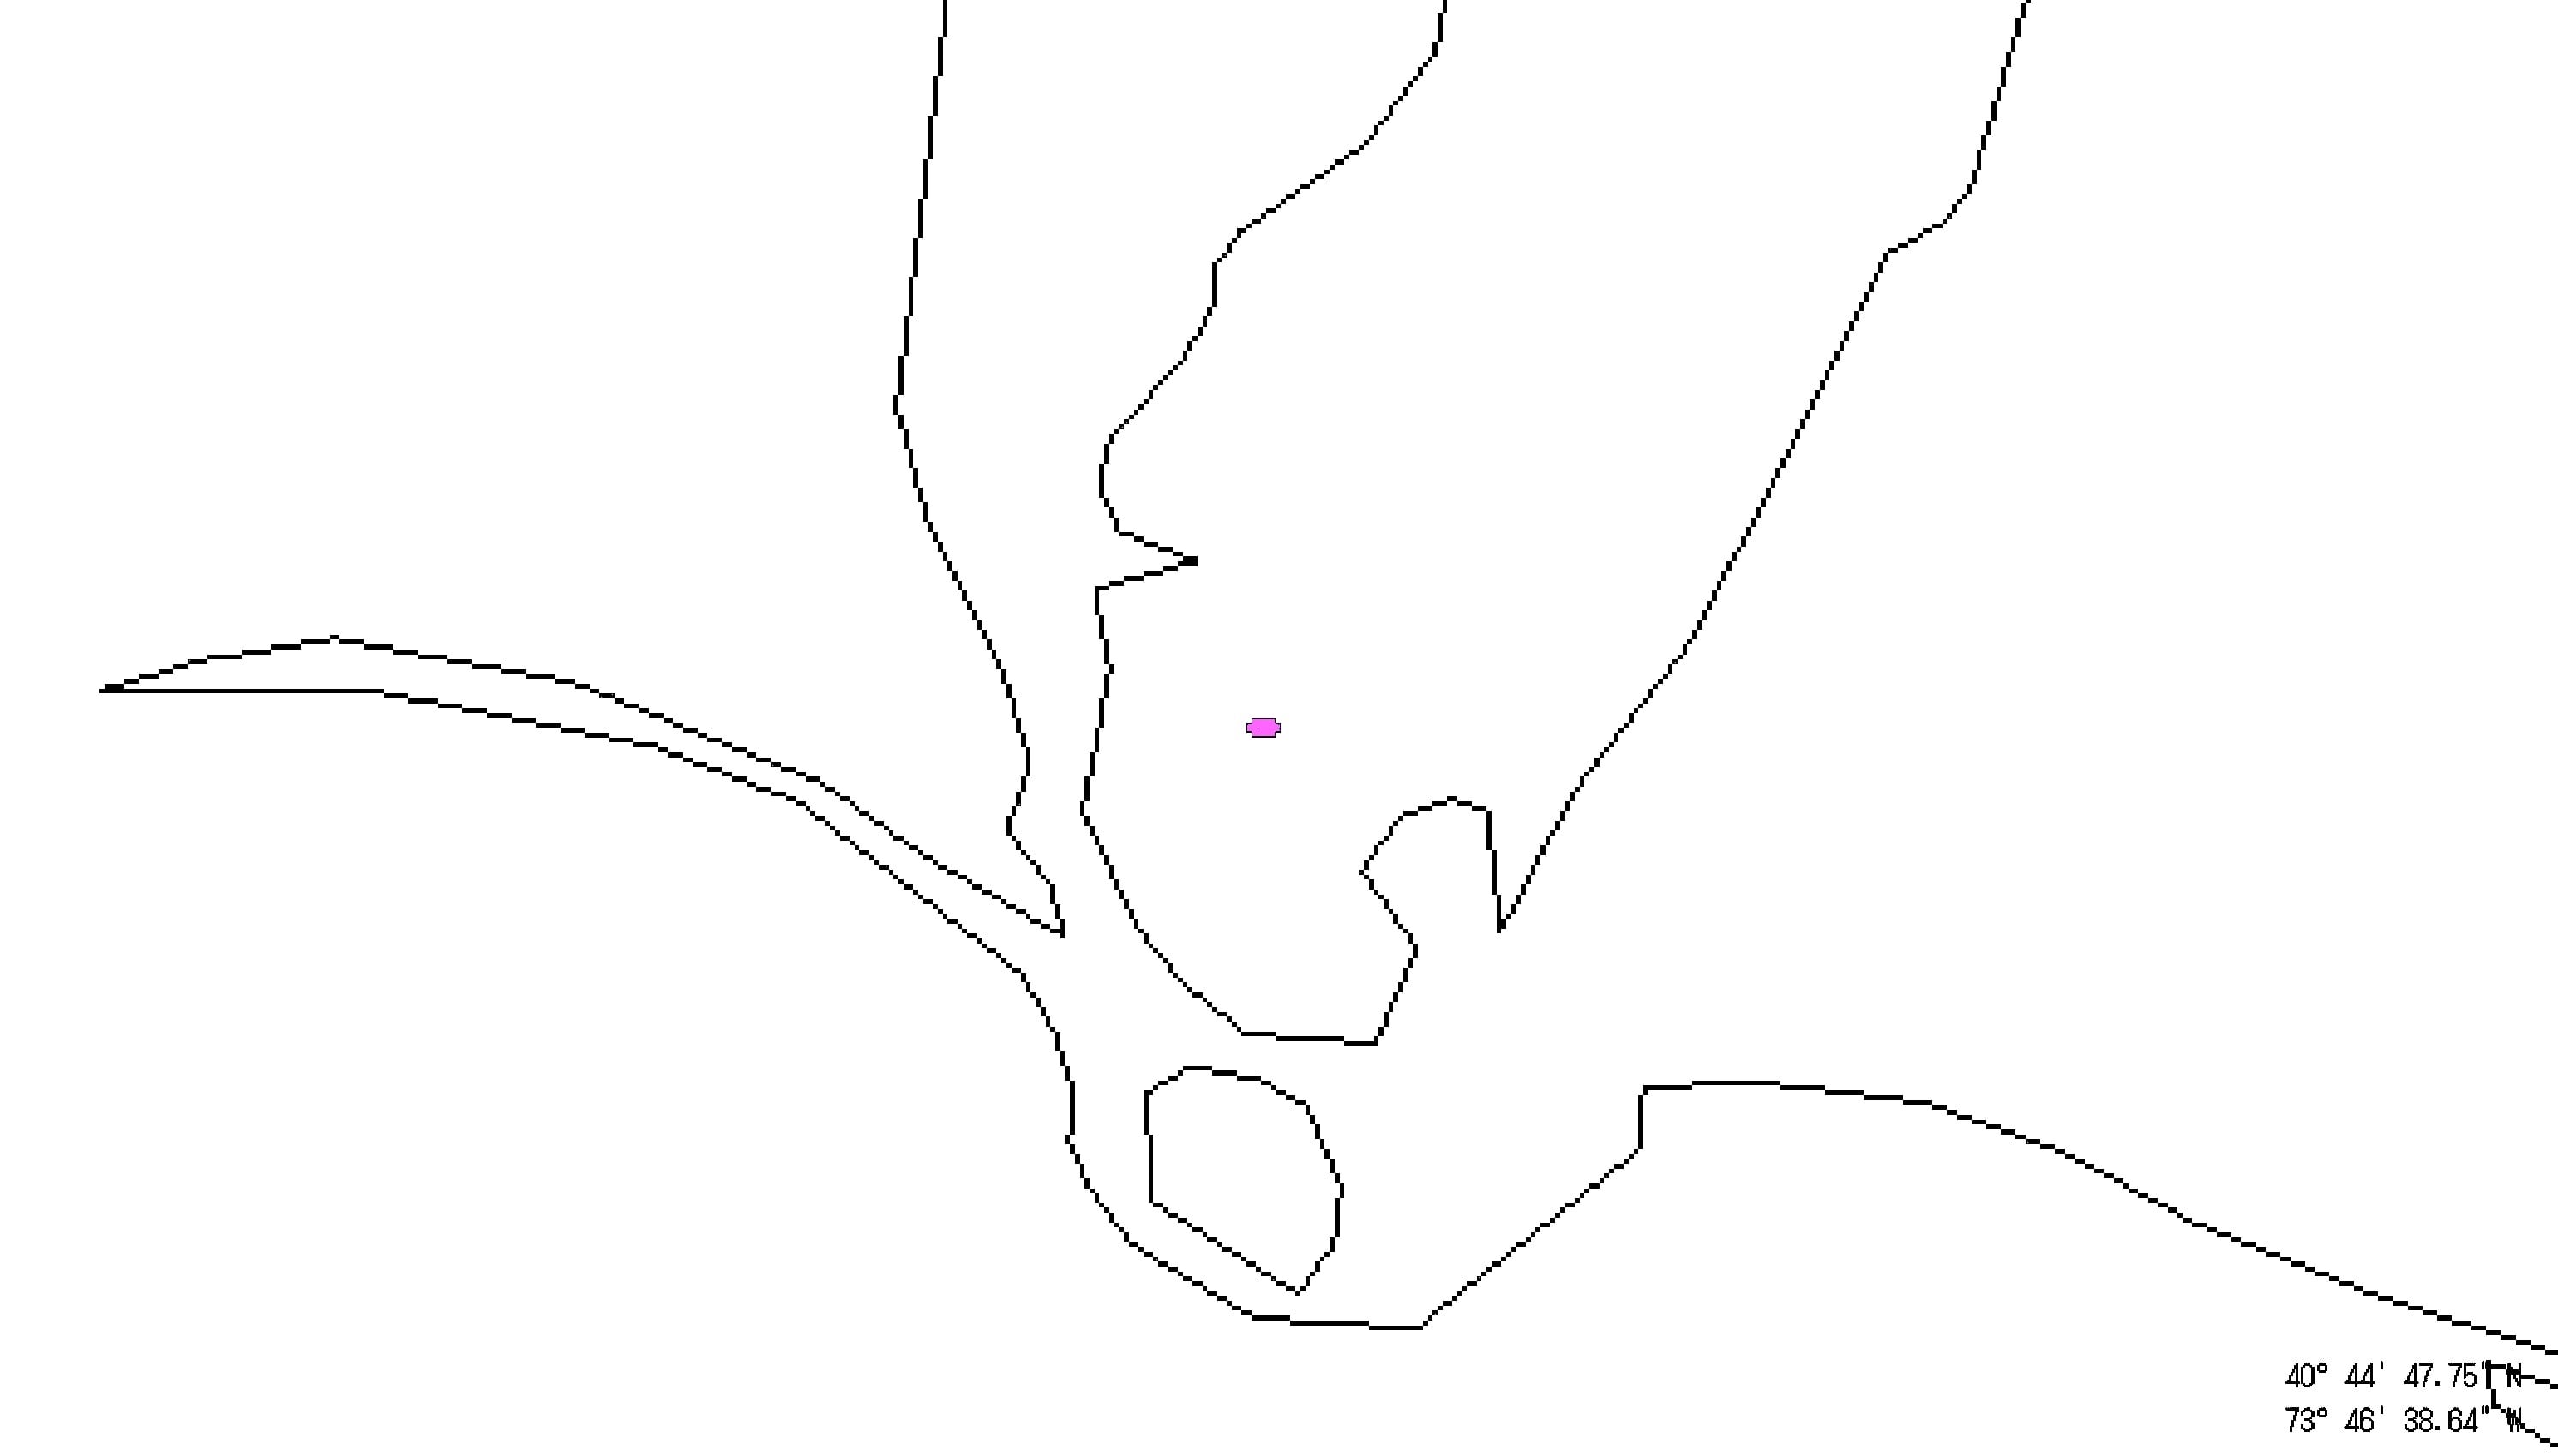
With the radio as inspiration, this project treats the map as an instrument in order to distort the division between the (scientific/musical) instrument as realtime (measurement/performance) tool, and the map as post-hoc interpretive device. The "remote sensor" presents spatial data as a sort of emergent and performable graphic score that unfolds based on user-controlled vectors.
Try playing the browser interface below. Toggle between map layers with the 1-4 keys.