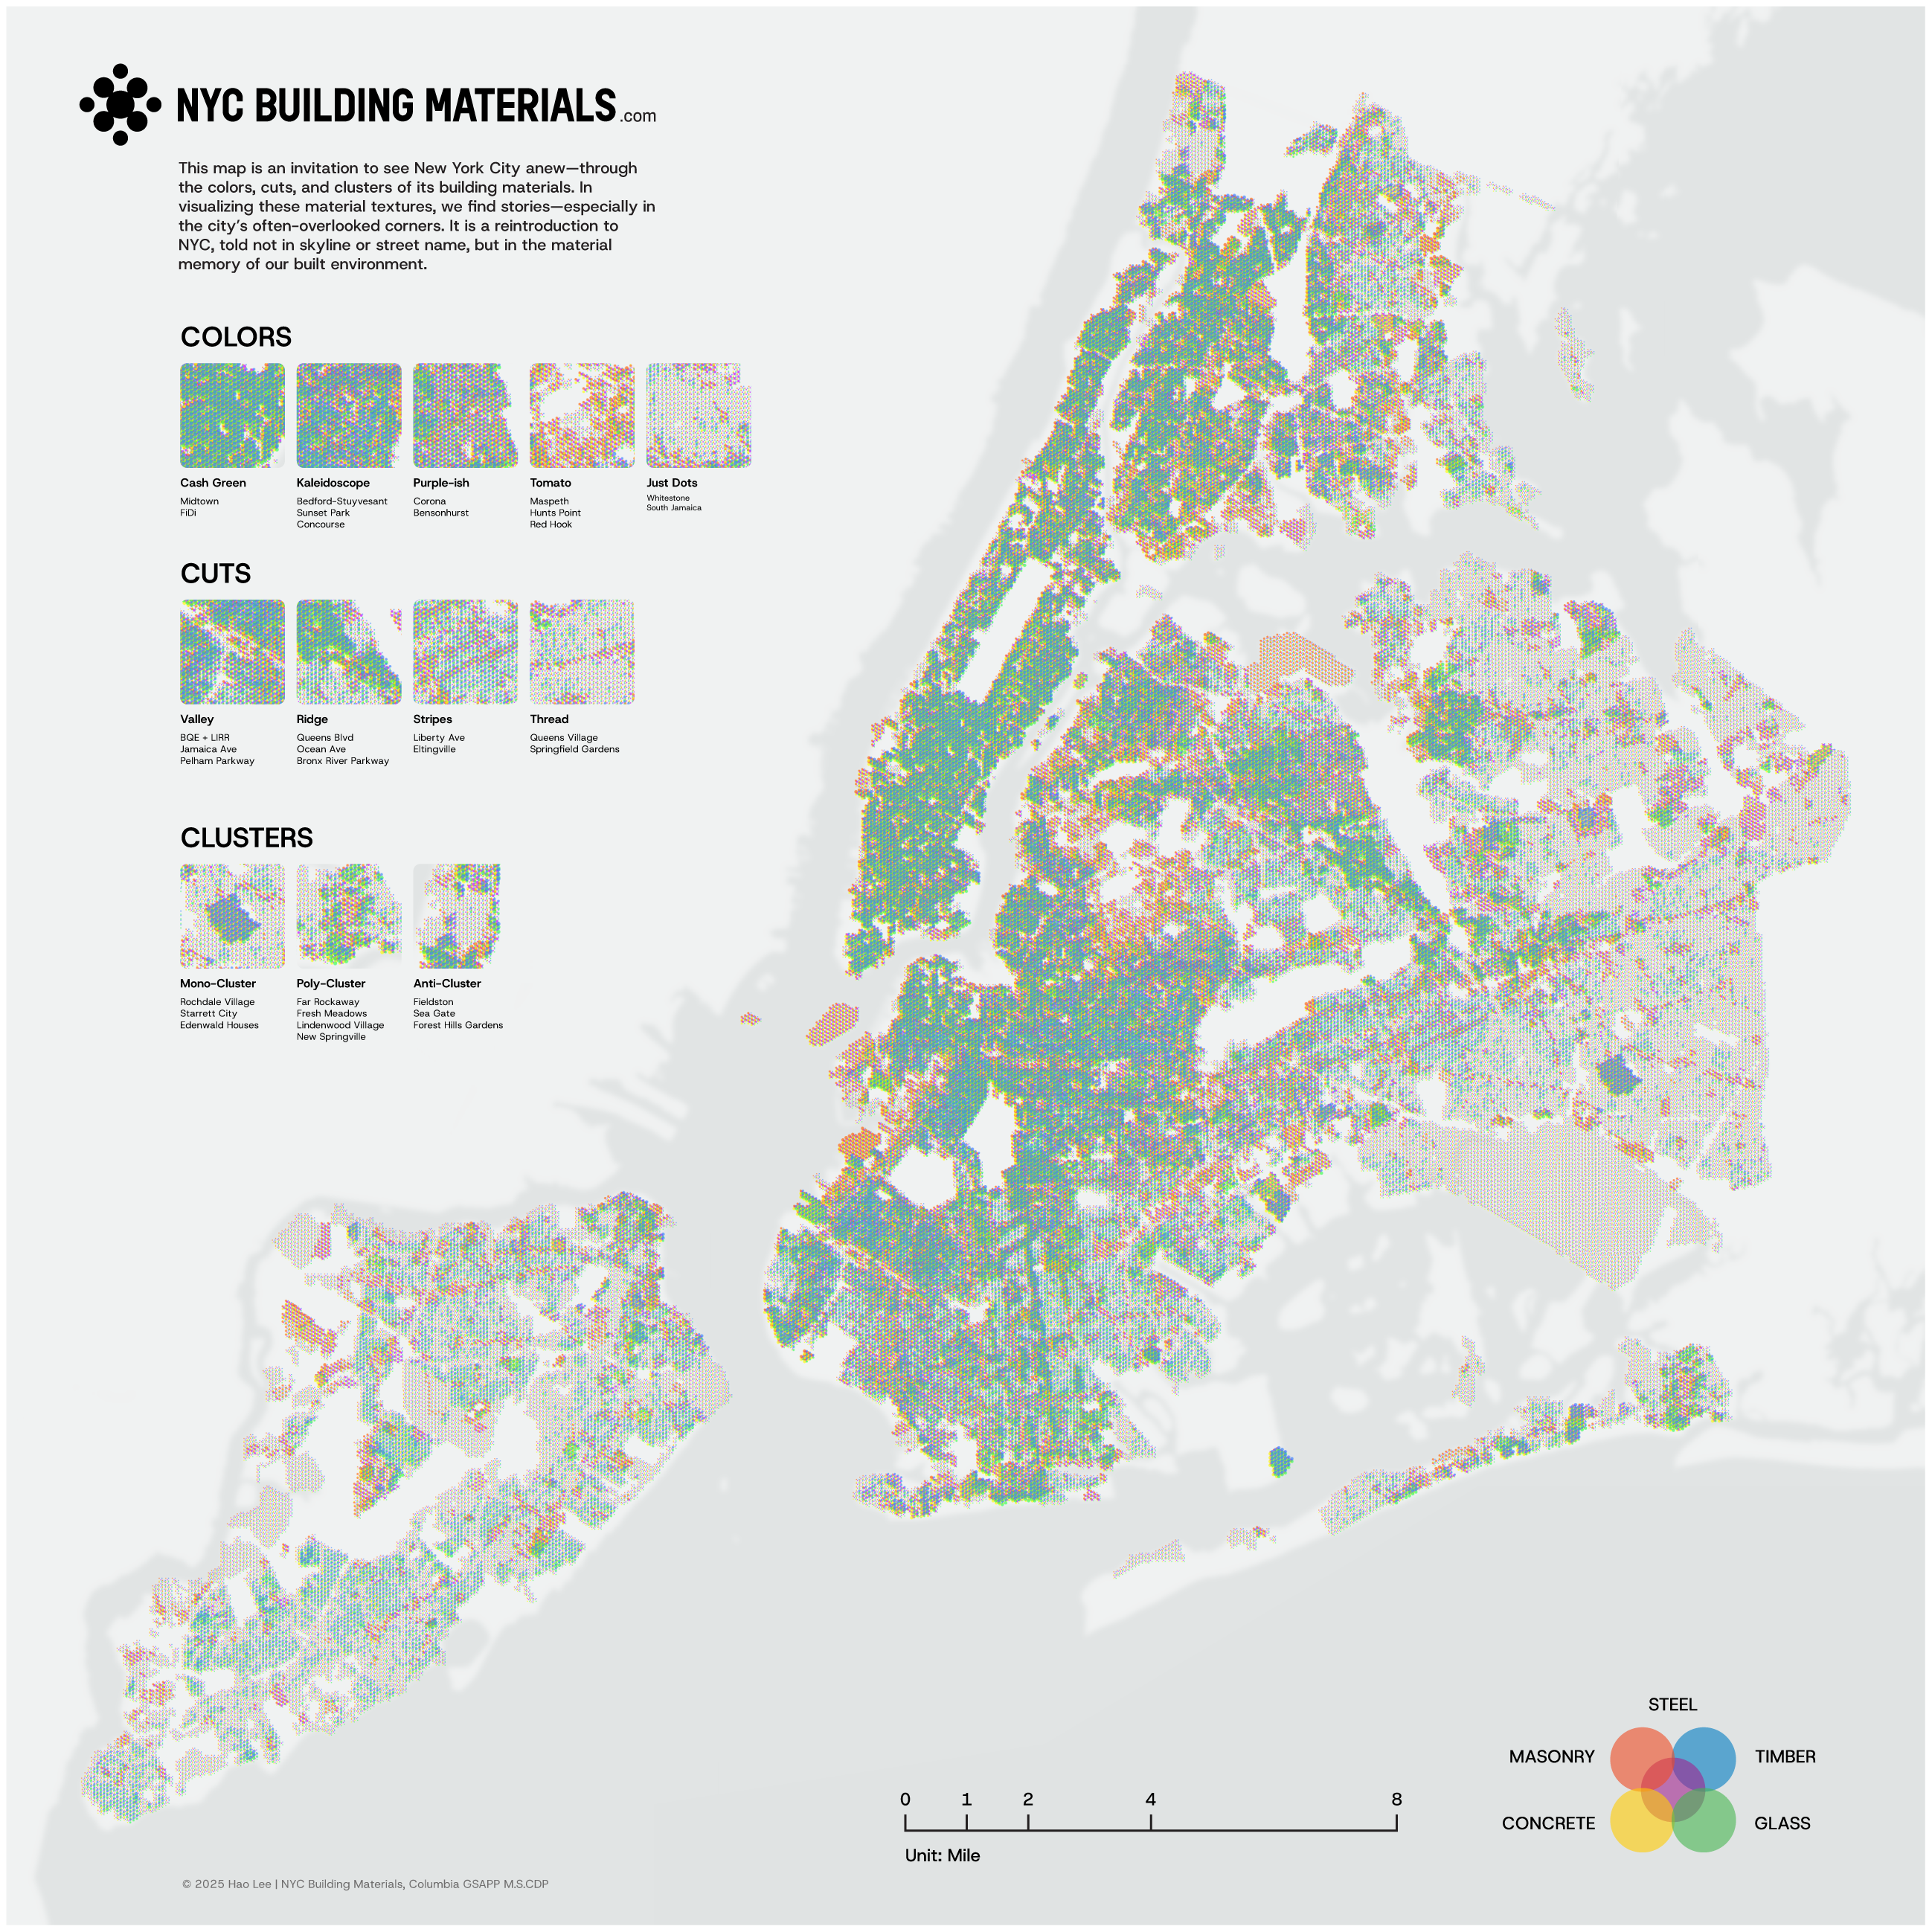
NYC Building Materials
Hao Lee
I've always taken a fondness on how Karl Popper approaches science in terms of replication. Since this program resides in the "of sciences" realm, it makes sense to adhere to this line of thinking when producing and structuring the design:
We do not take even our own observations quite seriously, or accept them as scientific observations, until we have repeated and tested them. Only by such repetitions can we convince ourselves that we are not dealing with a mere isolated ‘coincidence,' but with events which, on account of their regularity and reproducibility, are in principle inter-subjectively testable[1].
With that in mind, this article is geared towards explaining how this project came to fruition and documenting it in a way that is clear and concise.
What is NYC Building Materials?
A computational "census" for buliding materials.
An Old Fascination
I’ve always been fascinated by old buildings. Watching them get torn down and replaced by glass towers made me wonder: how many materials are packed into these structures, and how can we begin to grasp the scale of it all through visualization? How can we reintroduce ourselves to our built environment all through a material lens? That curiosity led me to the idea of building a platform where people could explore this question through interactive layers. It is about creating a holistic, interactive map of building material footprints—something that makes visible what’s often overlooked, and invites everyone to think critically about what we’re building, and what we’re losing.
Strategy Games and Shower Thoughts
Since this is a personal project, it’s only natural that my own interests would find their way in. I’m an avid gamer—the kind with thousands of hours logged on Steam alone. As someone who’s spent a lot of time playing RimWorld and the Civilization series, I kept thinking about how those games communicate complex systems through intuitive tile-based layouts. What if I could "borrow" these designs and utilize them in my architectural projects? What if these interactive designs could lend to more communitive projects? These evening hours role-playing historical figures and AI overseers eventually became a key influence for how I approach the data structure, visualization methods, and UI for a lot of projects.
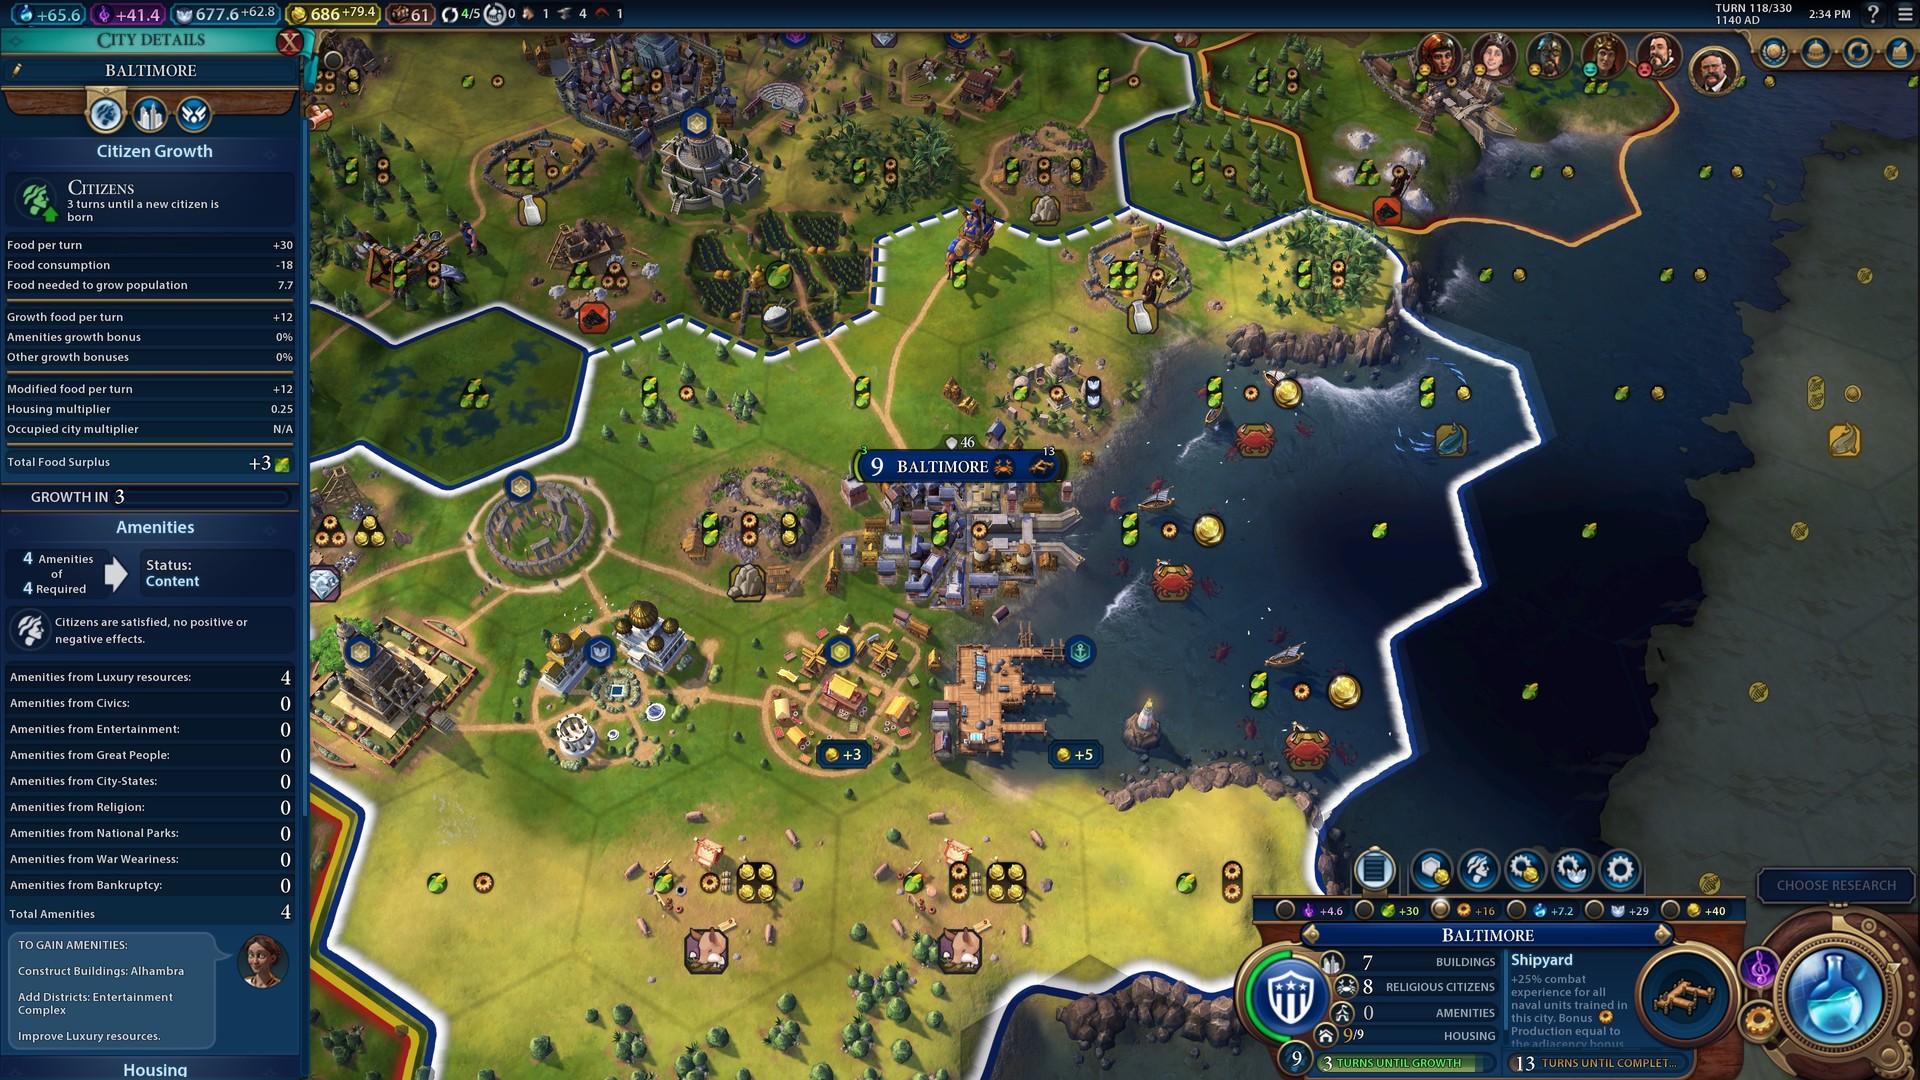
Screenshot courtesy of Firaxis Games / 2K Games. Source: Steam.
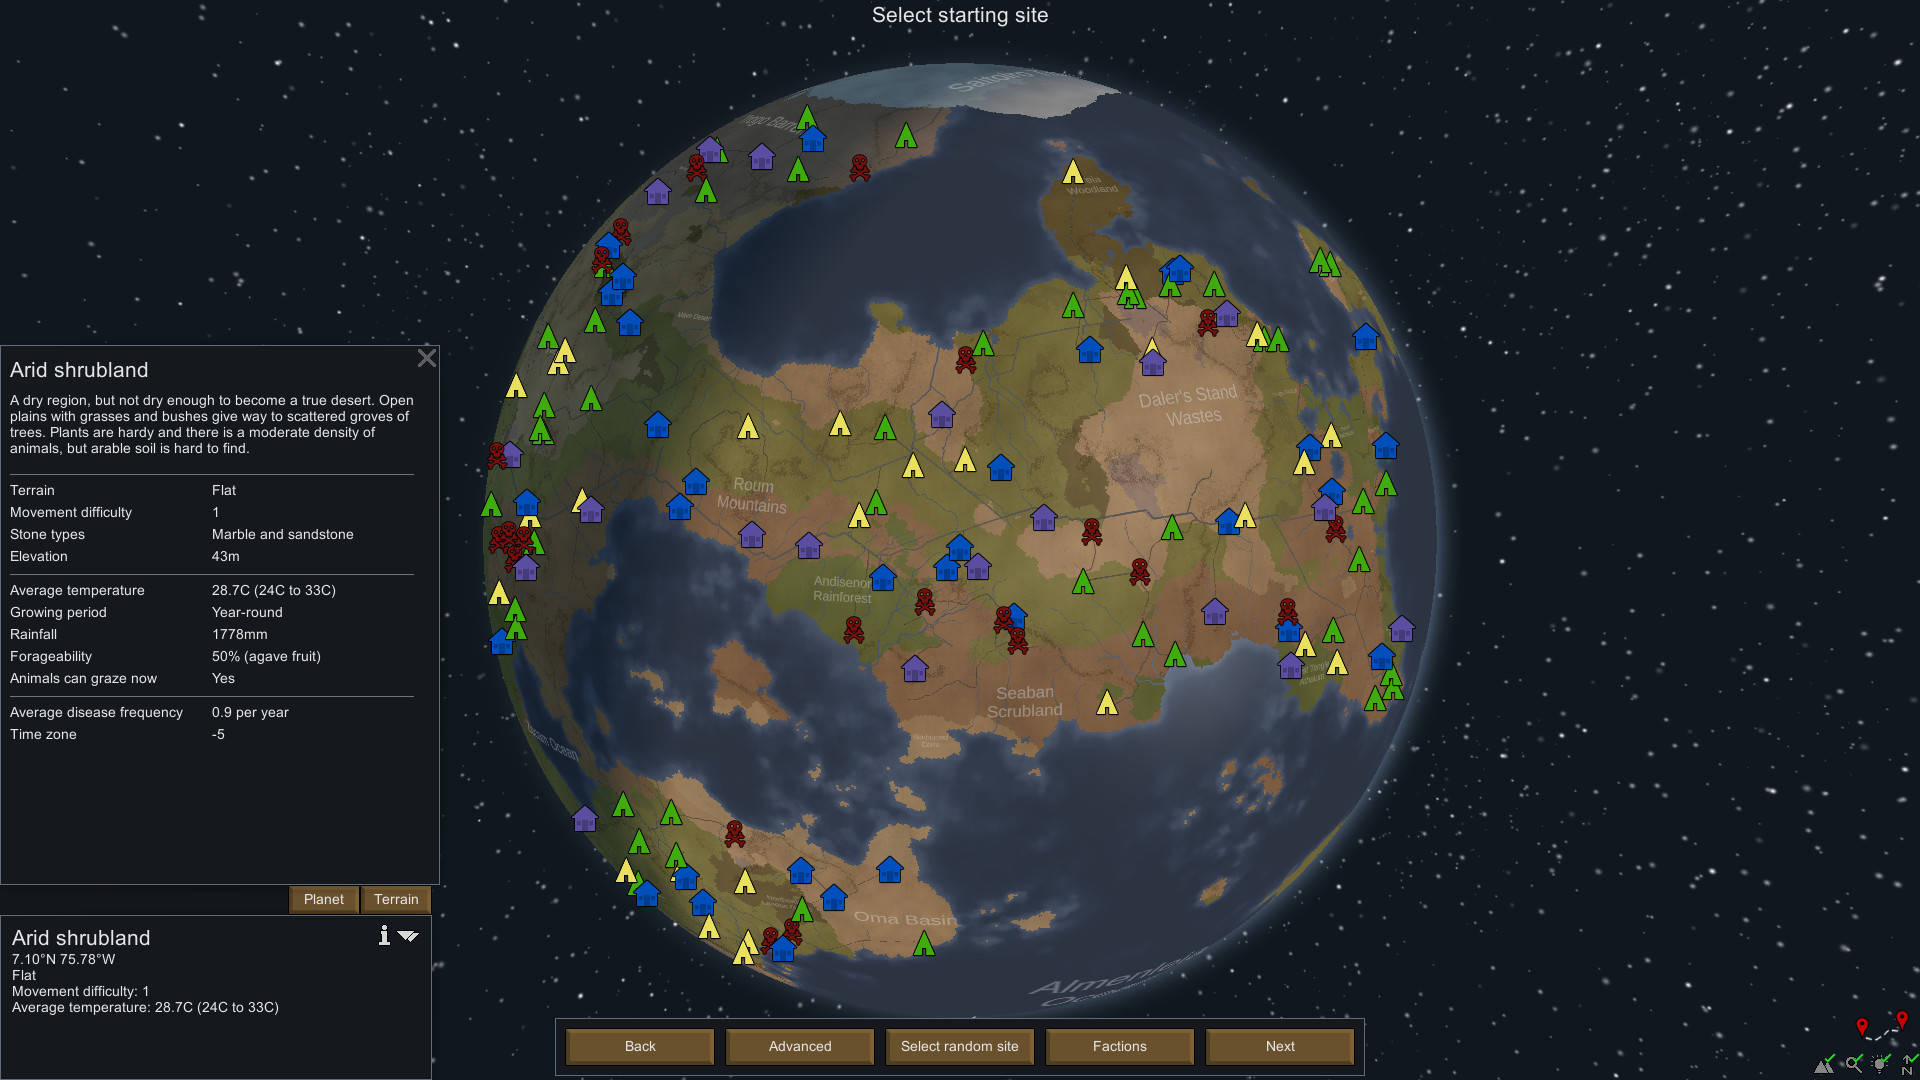
Screenshot courtesy of Ludeon Studios. Source: Steam.
The basic proposition employed is that any place is the sum of historical, physical and biological processes, that these are dynamic, that they constitute social values, that each area has an intrinsic suitability for certain land uses and finally, that certain areas lend themselves to multiple coexisting land uses[2].
Why Is This Important?
Another Window to Our Built Environment.
Urbex in Taichung
I like to think this project actually started back in 2019, when I was doing field research for my undergrad thesis. It focused on an abandoned theater complex in Taichung’s old entertainment hub—the Central District. It was bulit in 1954 and was abandoned in 2003 during the Taiwan SARS pandemic. The building was ten stories tall, now completely empty except for the basement, which had been converted into a parking rental for the neighborhood. I ended up talking my way in—playing my student card with the security guard to get 30 minutes inside. I wandered the whole building, floor by floor, from the basement to the rooftop.
Urban exploration—or Urbex, as some of us call it—is an emotionlly intense experience. Your senses sharpen because of the secrecy (or semi-secrecy, in my case), and you notice so much more than you would in a normal setting. It feels like stepping into an alternate reality where everything is still and silent, and you’re the only thing moving—slipping through layers of forgotten slices of life. The furniture was gone or trashed, fixtures torn out, and what remained were surfaces—tiles, textures, the bare bones of the hustle that once was. These were materials that couldn’t be salvaged, so they just sat there for a decade.
Now that the building has been demolished, taken apart and hauled away (in 2020, just one year after I graduated,) I feel an urge to tell a story. One about the identity of a city and how it’s shaped by its parts—its buildings. People come and go, interiors shift, and memories change, but the materials that linger hold a kind of silent presence. That deserves to be celebrated, and I knew, someday in the future, I'd have the opportunity to do so.
We need more pluralism in design, not of style but of ideology and values[3].
Creating A Local Building Material Platform
Fast foward six years later, I'm studying computational design in GSAPP Columbia. In my Colloquium class, there’s a reading I keep coming back to, mainly because of how the author frames local data as something shaped by dynamic, ongoing societal participation. Out of all the great readings in that class, that one really stuck with me:
All data are local. Indeed, data are cultural artifacts created by people, and their dutiful machines, at a time, in a place, and with the instruments at hand for audiences that are conditioned to receive them[4].
This got me thinking: how can I take an instrument I know how to play and write a song that resonates—not just with an audience, but with myself? How can I create a platform that reveals how building materials shape the identity of our local environments? The challenge is, I don’t know the instrument yet. I’m an architect, and web development and coding are still very new to me. So where do I begin?
Why Is This Important?
Another Window to Our Built Environment.
Where This Project Began
One of my first projects in the M.S. CDP program was to build an interactive website that mapped out the broad strokes of my potential capstone. Gorilla Urbanism used layered masks to create an x-ray effect—revealing Manhattan’s building floor-area-ratios alongside their respective occupancies. Not bad for a first-time web dev, right? You can already sense something brewing here—something about usage, visibility, and x-ray ways of seeing the city.
In the Fall semester, I also made an attempt at documenting NYC's building age and demolition using data from NYC OpenData. A simple static map that shows the "birth, life, and death" of NYC buildings. Now it's more about lifecycles and materials.
Finally, during Colloquium II by Laura Kurgan and Snoweria Zhang, they showed a case study on how computational design could be utilized in AEC and adjacent industries: Climate—Conflict—Vulnerability Index by Moritz Stefaner.
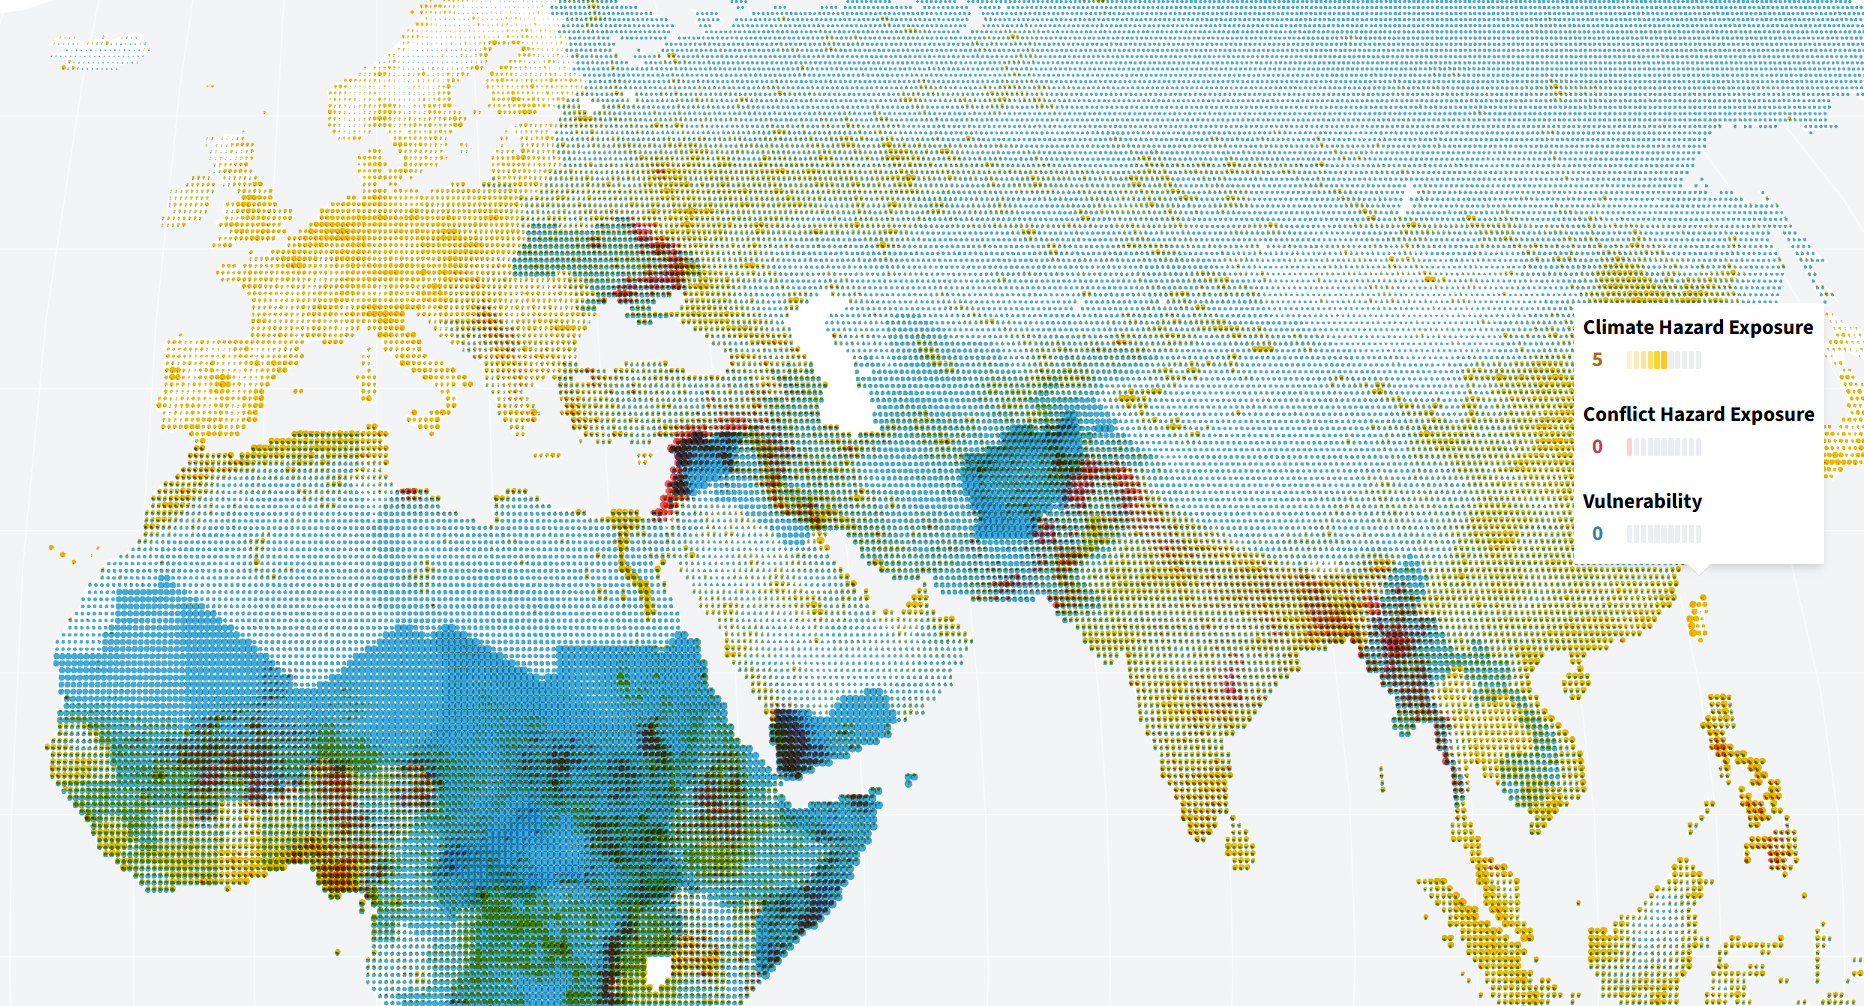
This project became the final push behind NYC Building Materials. I realized I could build a web platform that reintroduces users to New York City through a purely material lens: combining interactive tools like x-ray masks, GIS data analysis, and web-based visualization techniques. It'll invite users to engage with critical questions of sustainability and urban identity, presenting those data in an interactive, participatory manner.
How Does It Work?
Open Data + Machine Learning + D3.JS
Missing Data
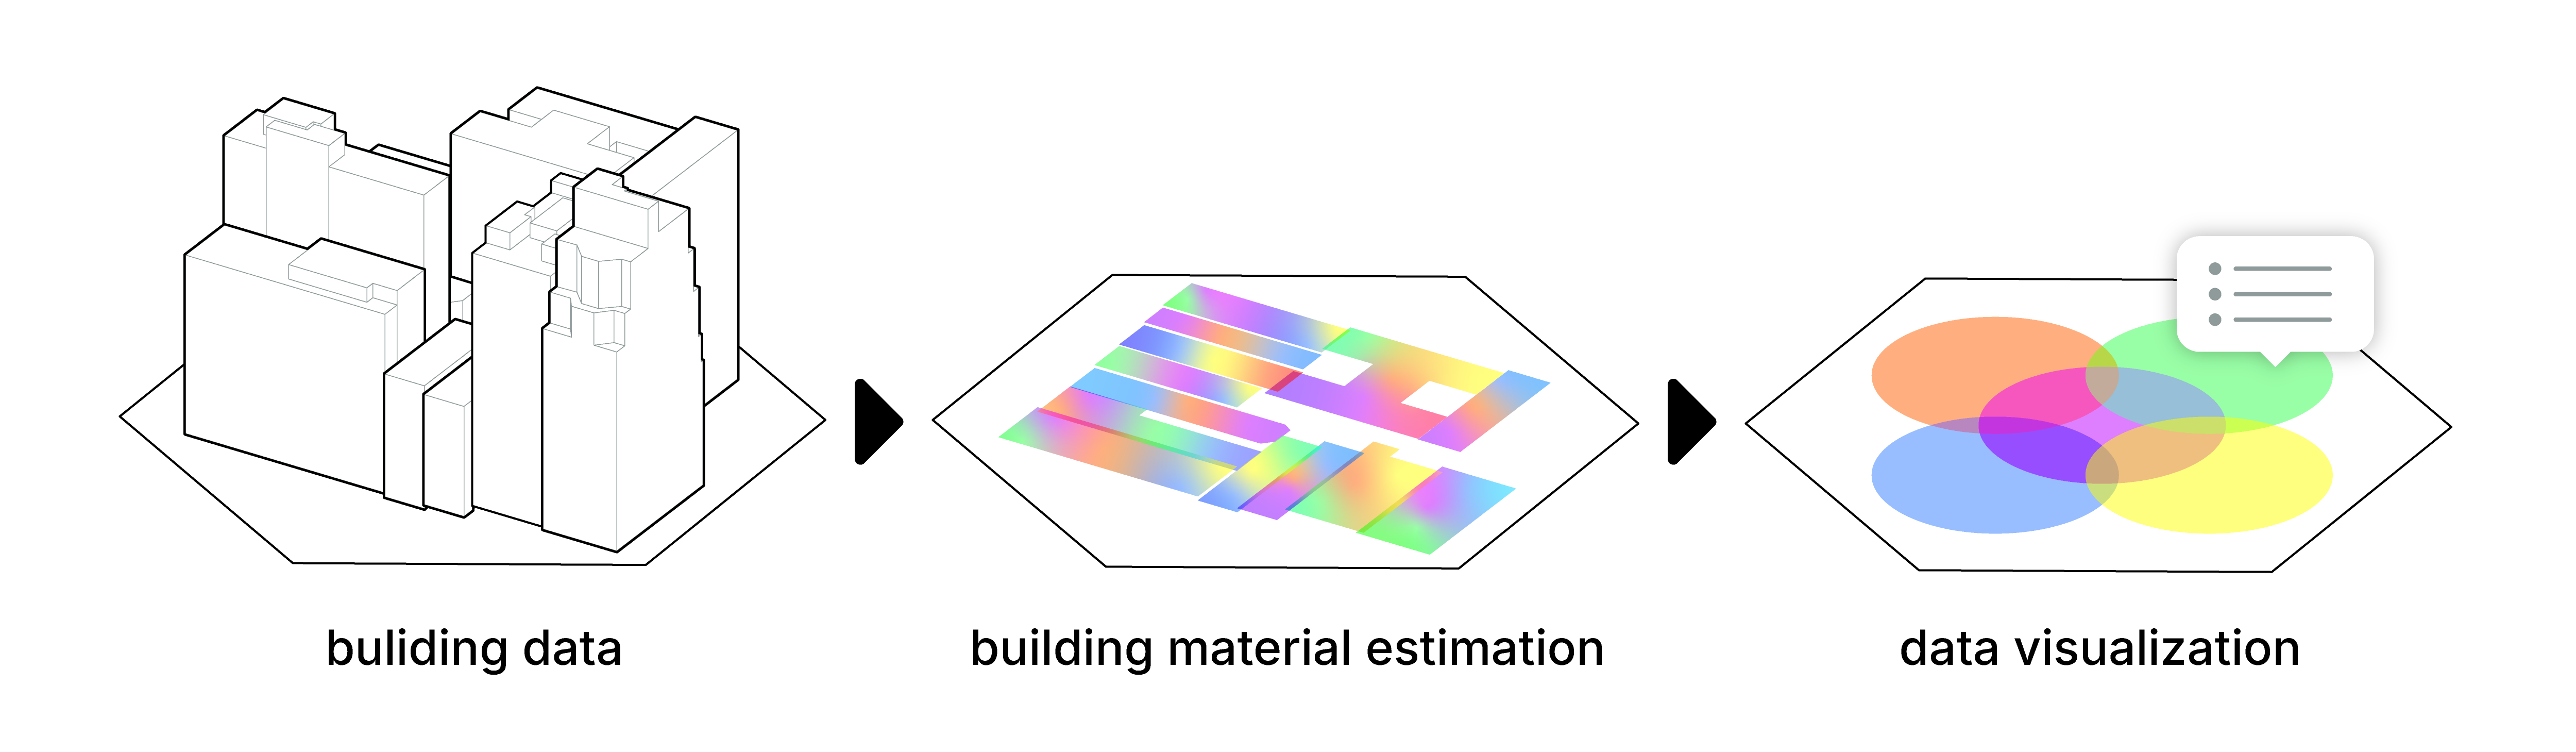
At its core, this project functions like a city-wide BIM model; looser in scope, but built for comparison and exploration. To make something like this work, I needed data. While NYC Open Data offers a wide range of public datasets, none mapped building materials at the lot* level. So, I decided to build that dataset myself.
*Lot (building lot): a plot of land designated for constructing a building, often a house or other structure.
Part 1 of 4: Clustering Buildings And Assigning Material Profiles
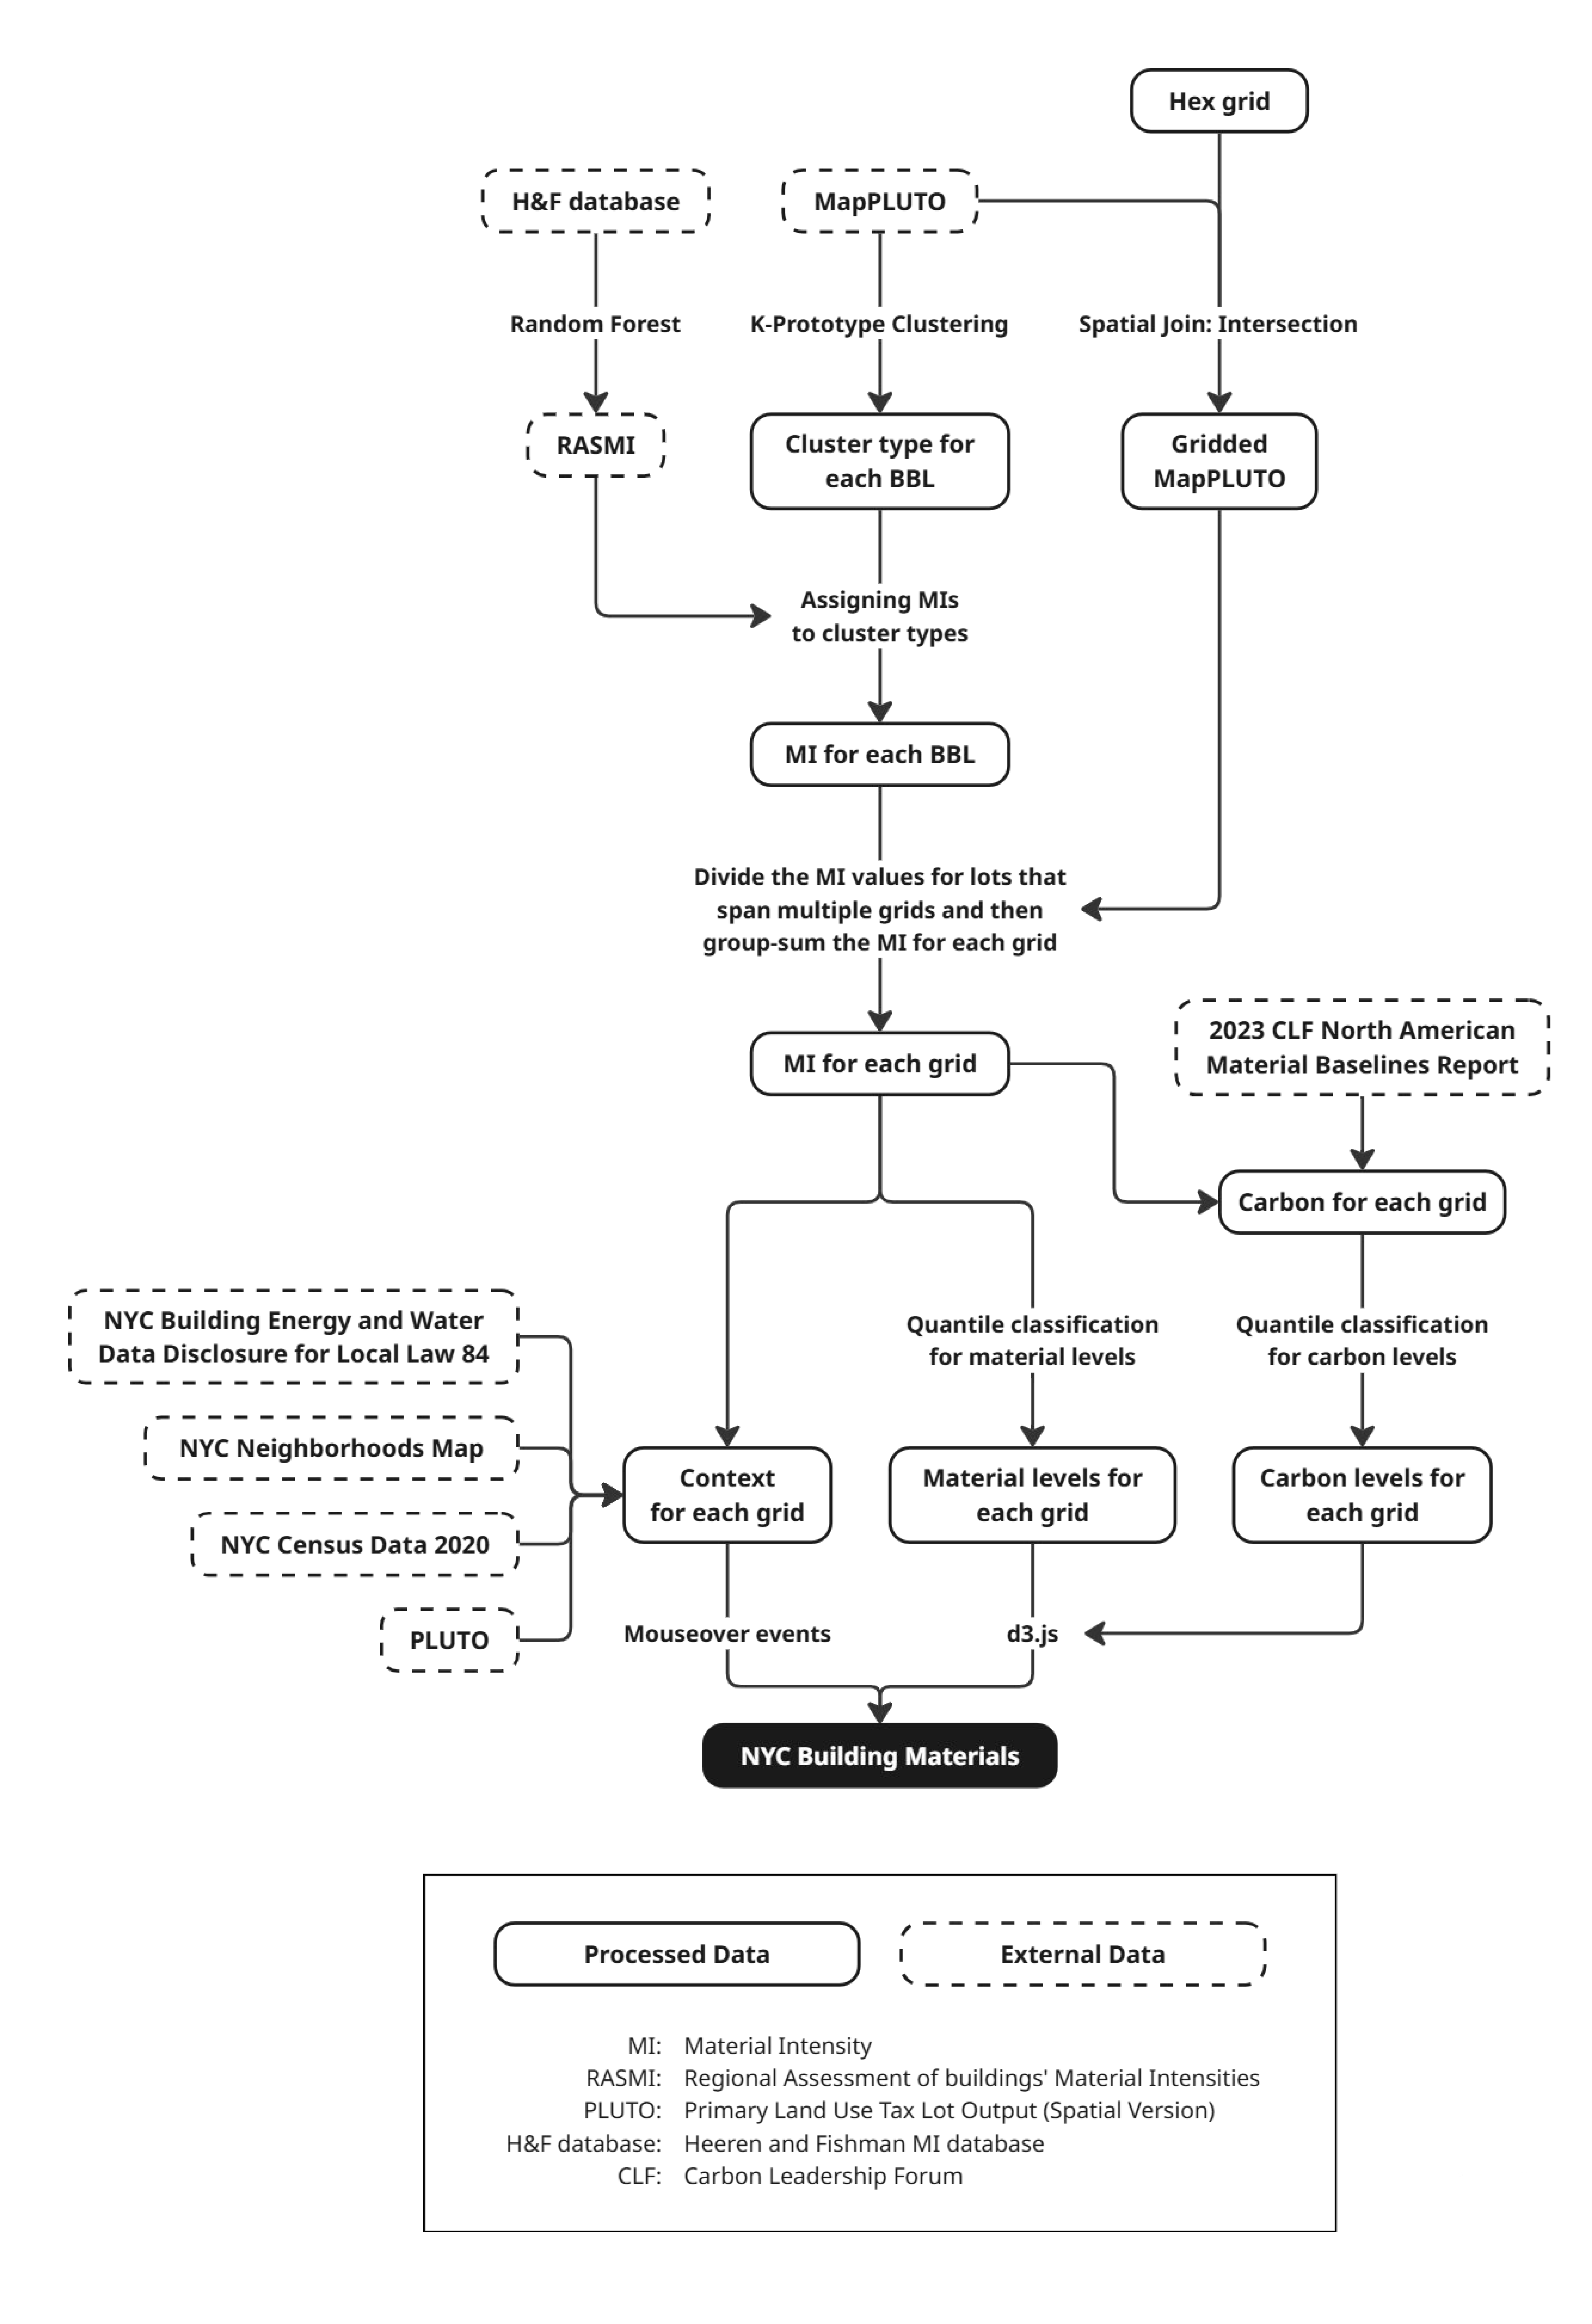
To estimate building materials across NYC, I first needed to cluster buildings by type. This step helps define the range of building typologies before assigning material compositions using external datasets. While it's possible to categorize buildings directly using PLUTO data, such as age, use type, land use, and ownership, clustering provides a more holistic view of the city's building landscape that also helps prioritize which clusters to flesh out in more detail for accurate material estimation.
By using Python's scikit-learn K-Prototype clustering, NYC buildings could be defined in six clusters, and their general characteristics are as follows:
- One- and Two-Family Residential Homes (70.64%)
The vast majority of buildings in this category are located in residential zones, primarily constructed between the 1920s and 1960s. These low-rise homes make up over 70% of the building stock, reflecting suburban-style developments across the outer boroughs. - Multi-Family Elevator and Mixed Residential-Commercial Buildings (16.33%)
Found mainly in residential zones, these structures blend residential units with ground-floor retail or community use, and most were built between 1910 and 1930. - Commercial and Office Buildings (7.53%)
Concentrated in commercial zones, these mid-20th-century buildings—dating from roughly 1925 to 1970, representing a mix of retail corridors, office blocks, and business centers. - Multi-Family Walk-Up Apartments (2.61%)
These buildings, lacking elevators and generally rising three to five stories, are a staple of older residential neighborhoods built between 1910 and 1960. - Industrial and Manufacturing Facilities (1.58%)
Located in industrial zones, these buildings were largely constructed between 1930 and 1970. They speak to NYC’s industrial past, now often adapted for creative or logistical uses. - Public Facilities and Institutional Buildings (1.31%)
Schools, churches, libraries, and other civic structures make up this final category. Though placed within residential zones, their functions stand apart. Most were built between 1925 and 1965, during periods of public infrastructure expansion.
For the next step, I’m combining the Regional Assessment of buildings’ Material Intensities (RASMI) by Tomer Fishman et al.—a dataset that blends empirical material studies with synthetic estimates expanded through a random forest model—with my own building clusters. Each cluster is then further divided by building age, borough, height, ownership, and use type to define more precise material profiles. The result is a custom dataset that assigns estimated quantities of timber, glass, concrete, masonry, and steel to every land lot in the city, effectively creating BIM-like data for the entire built environment of NYC.
All things are related, but nearby things are more related than distant things. - Walter Tobler, First Law of Geography[5].
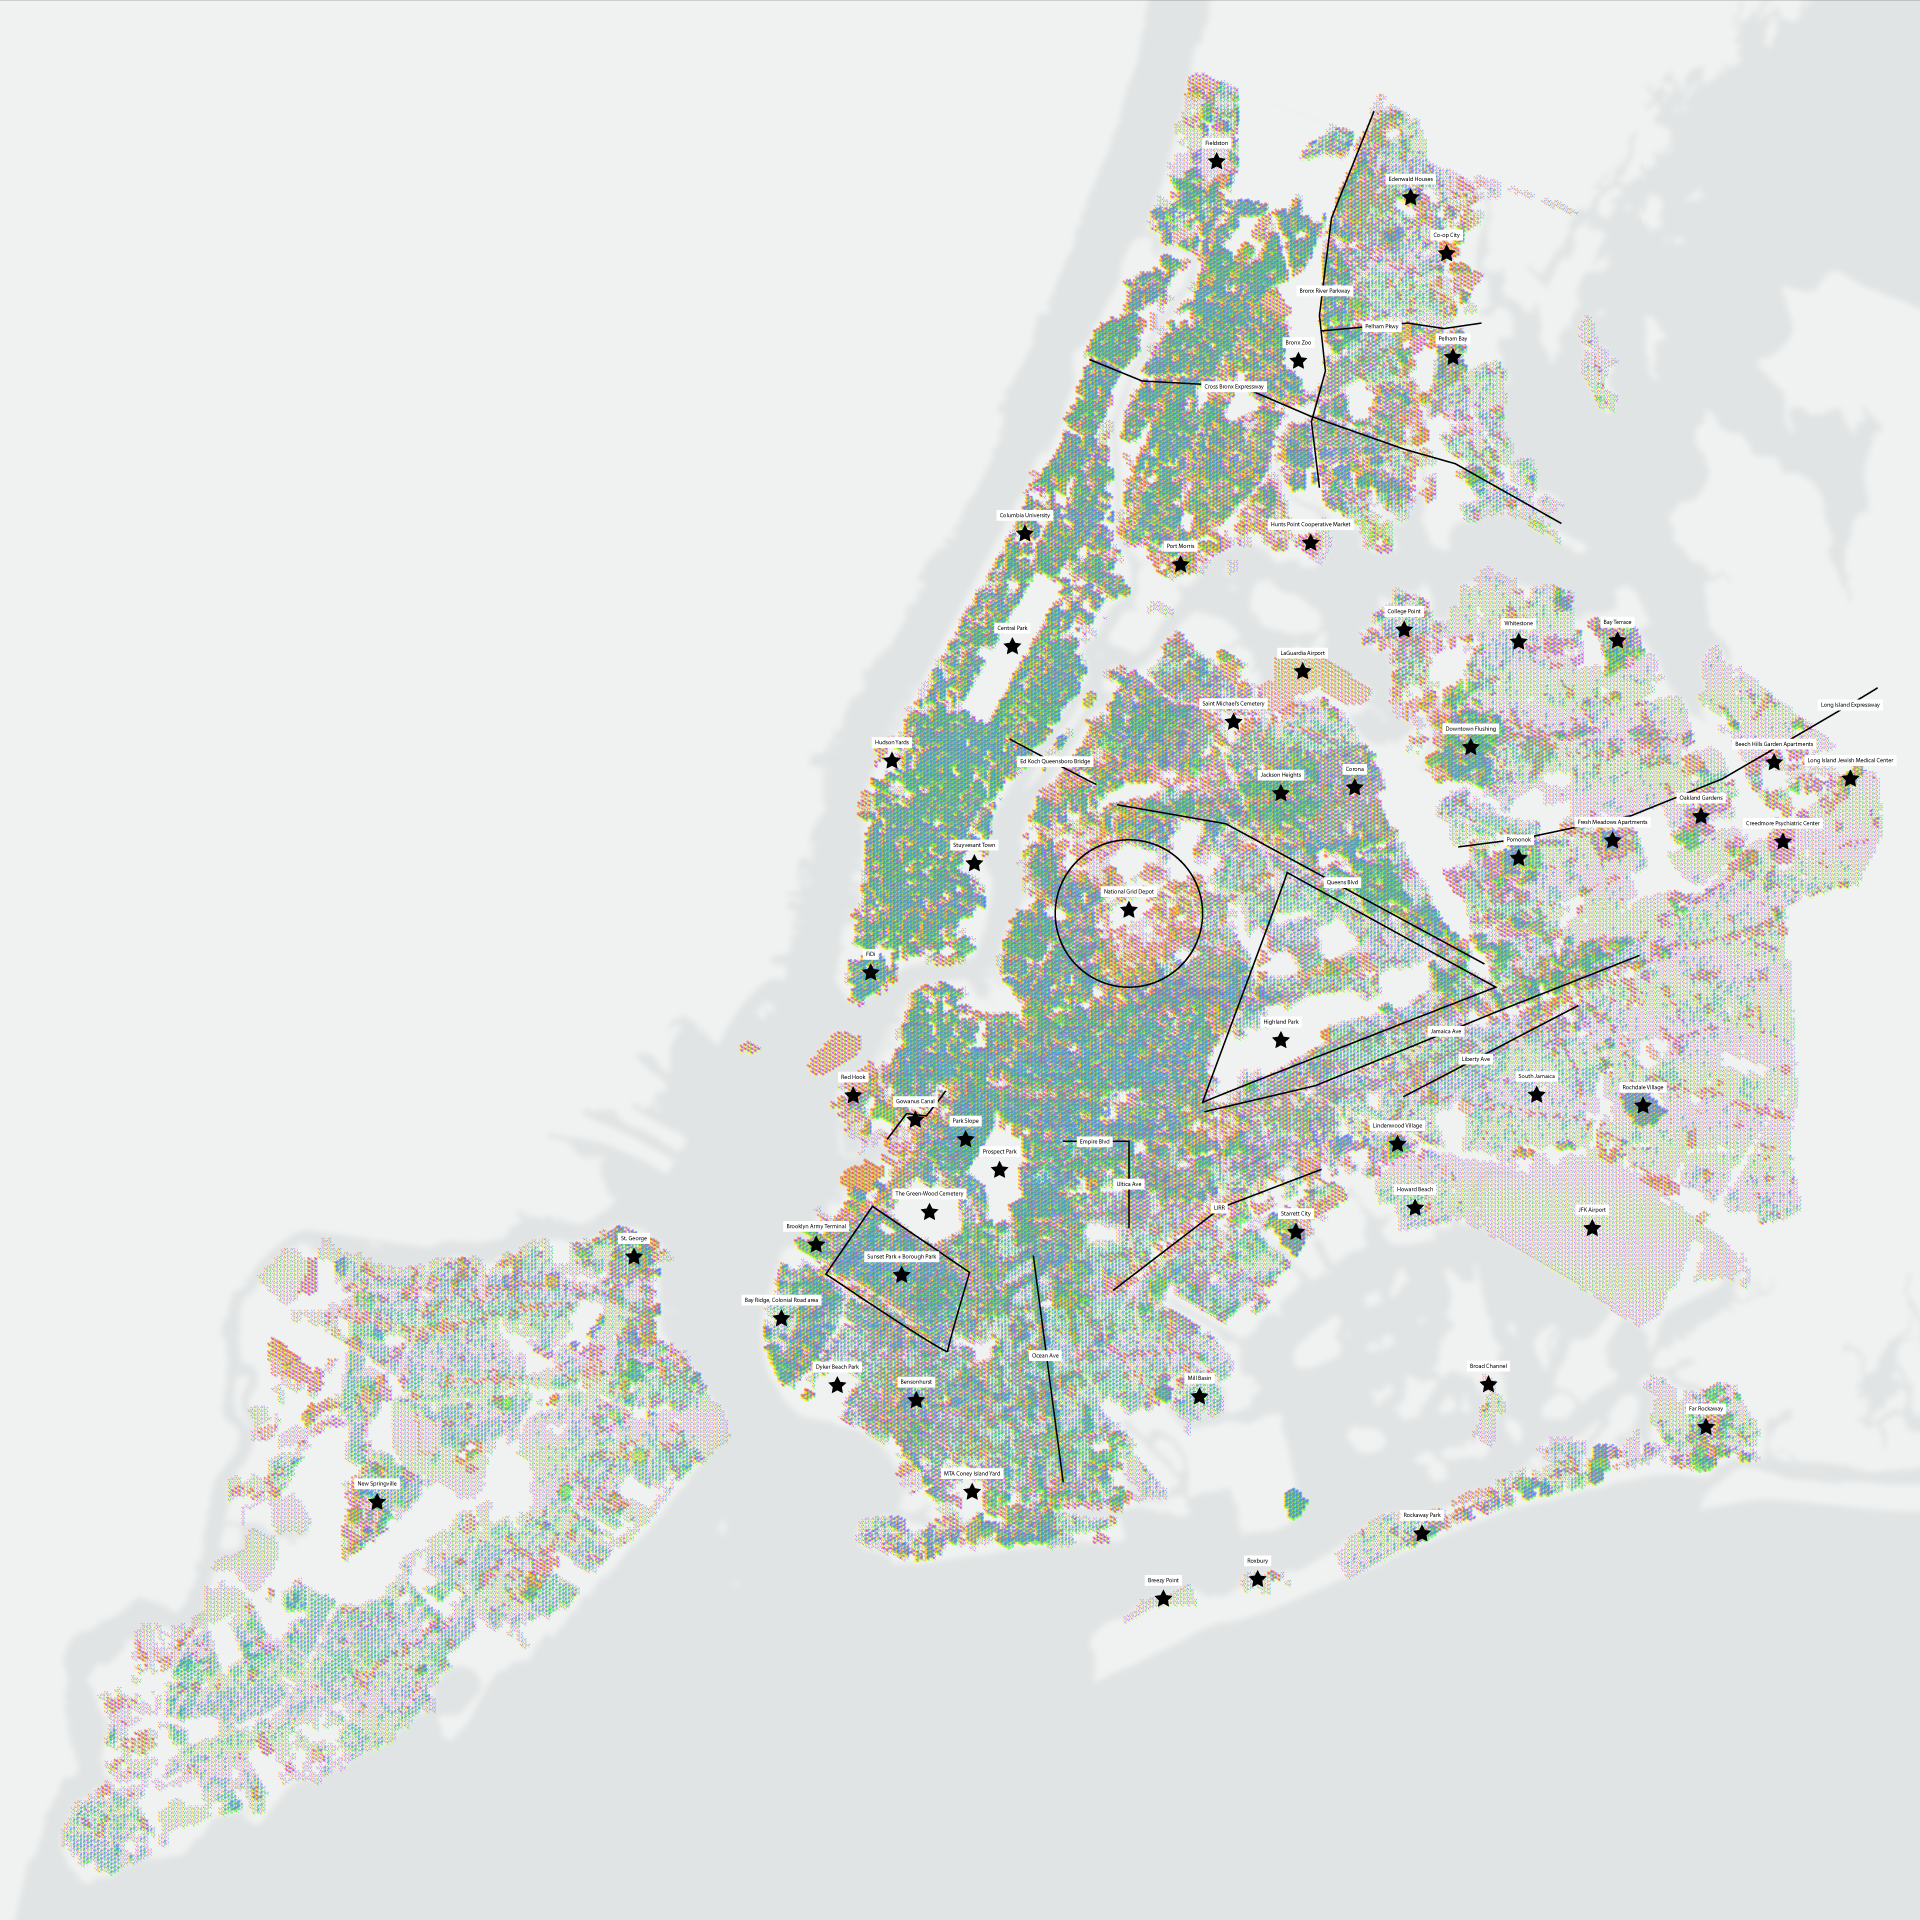
Part 2 of 4: Visualizing Material Data
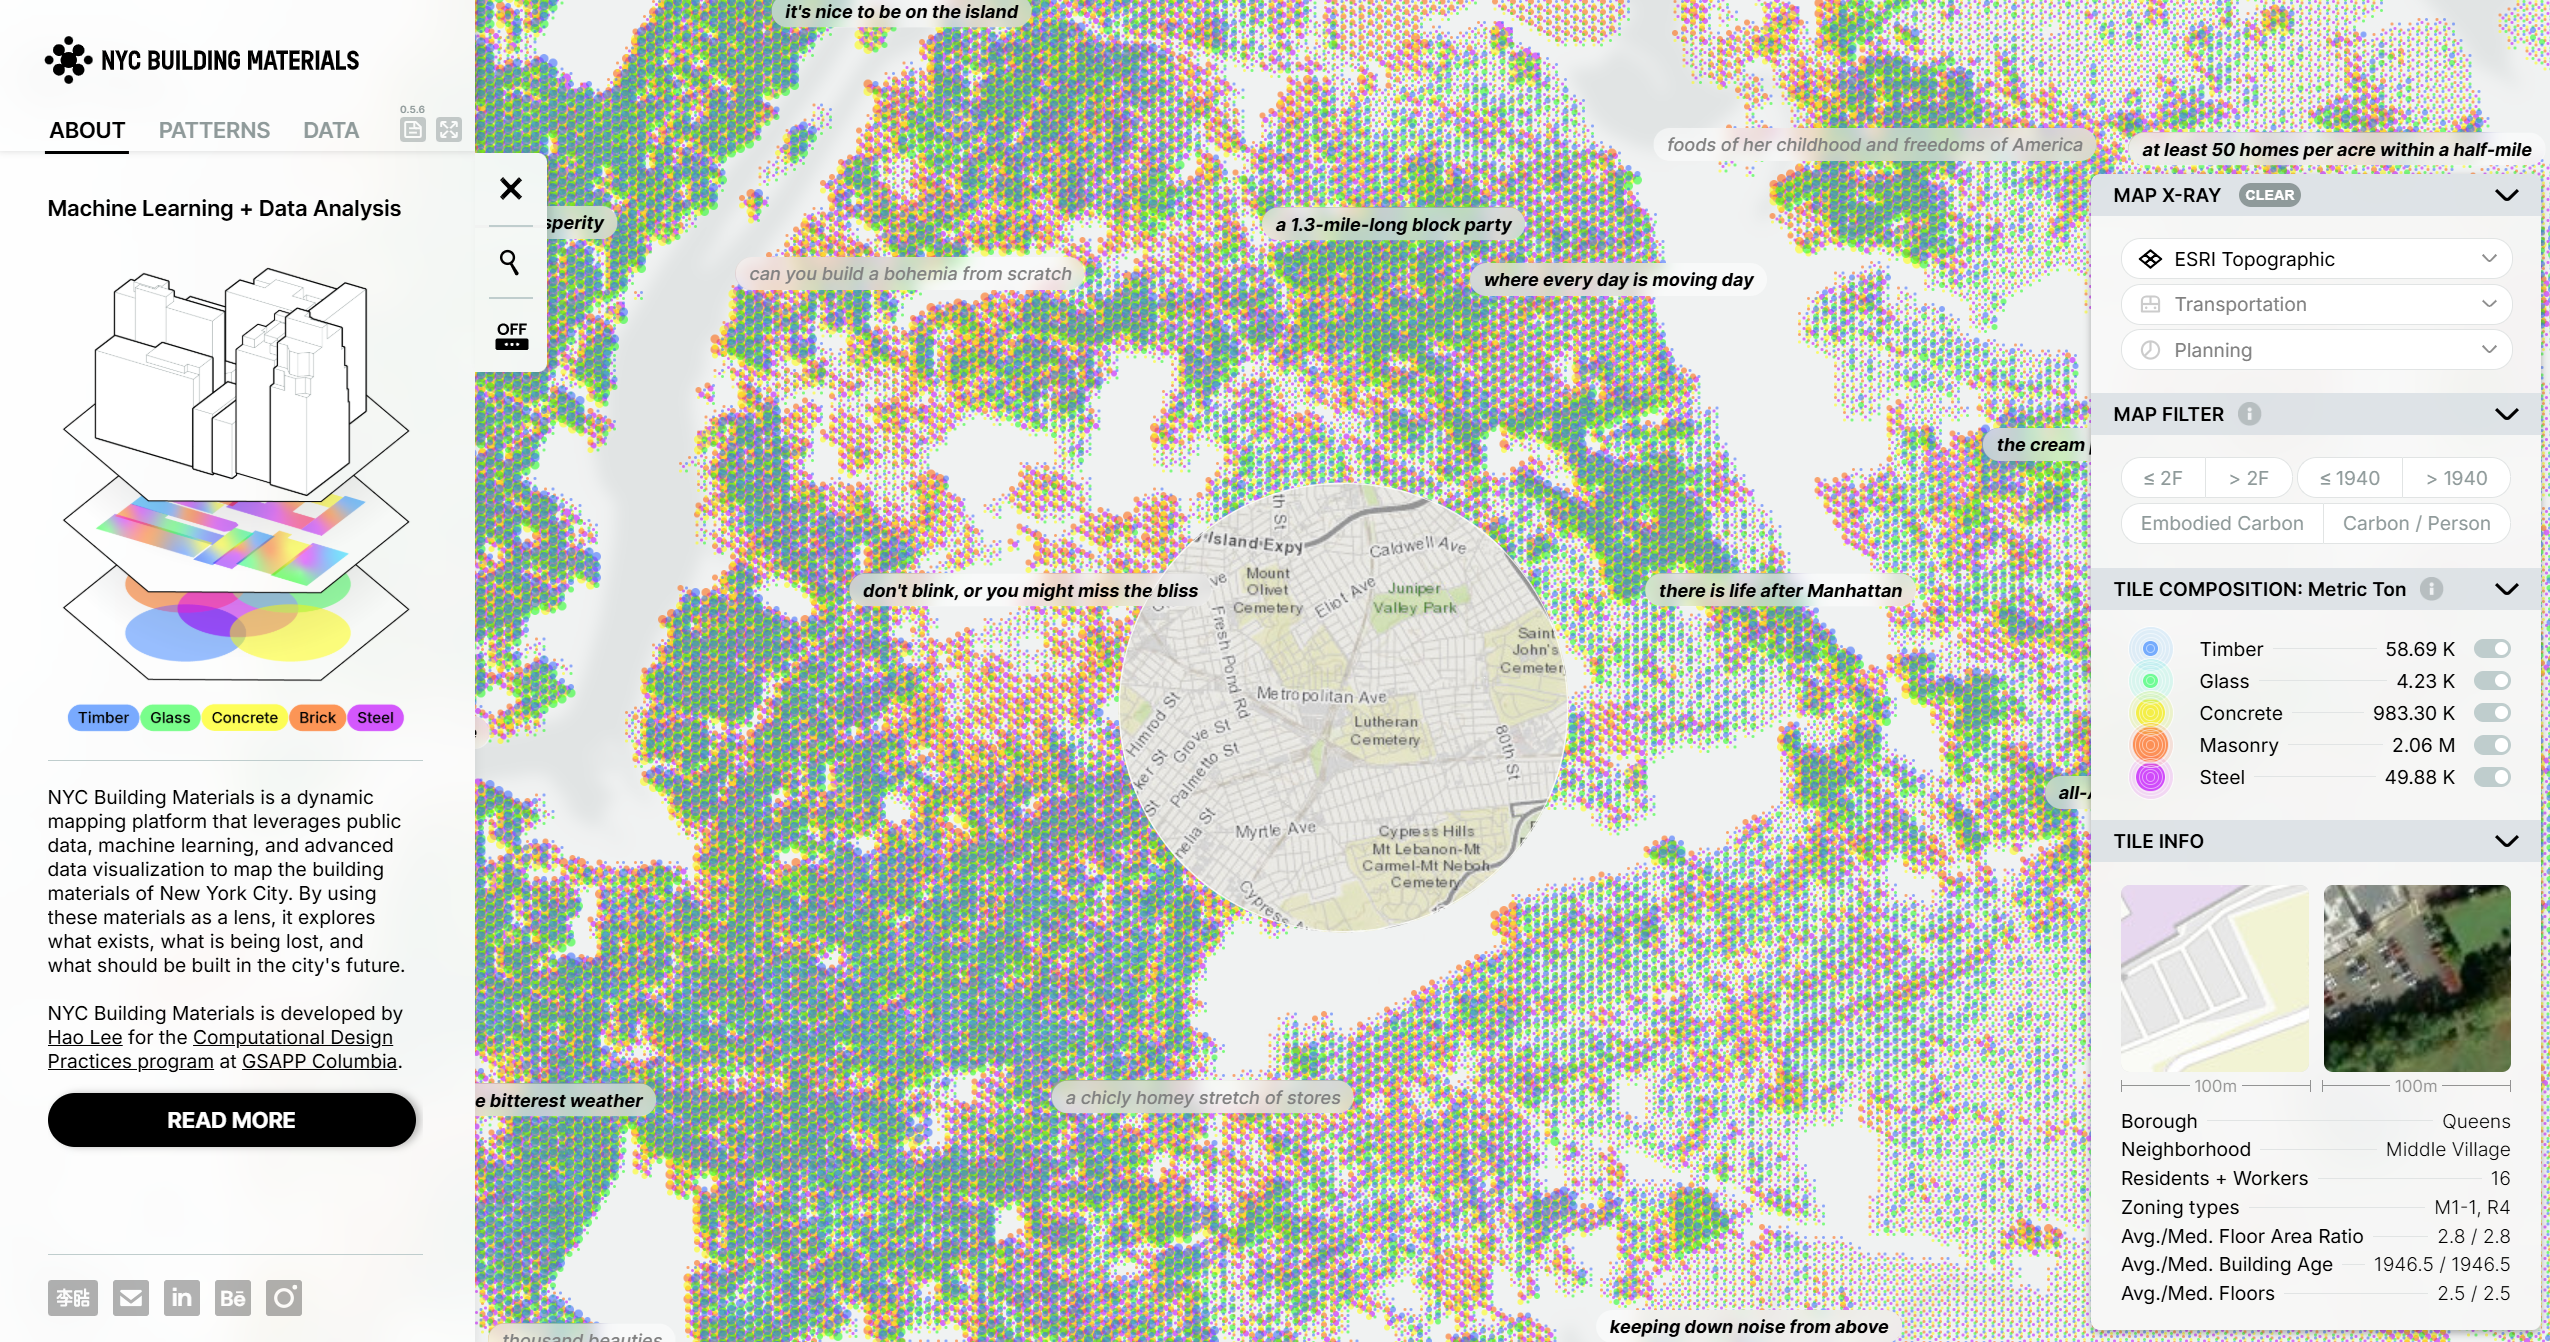
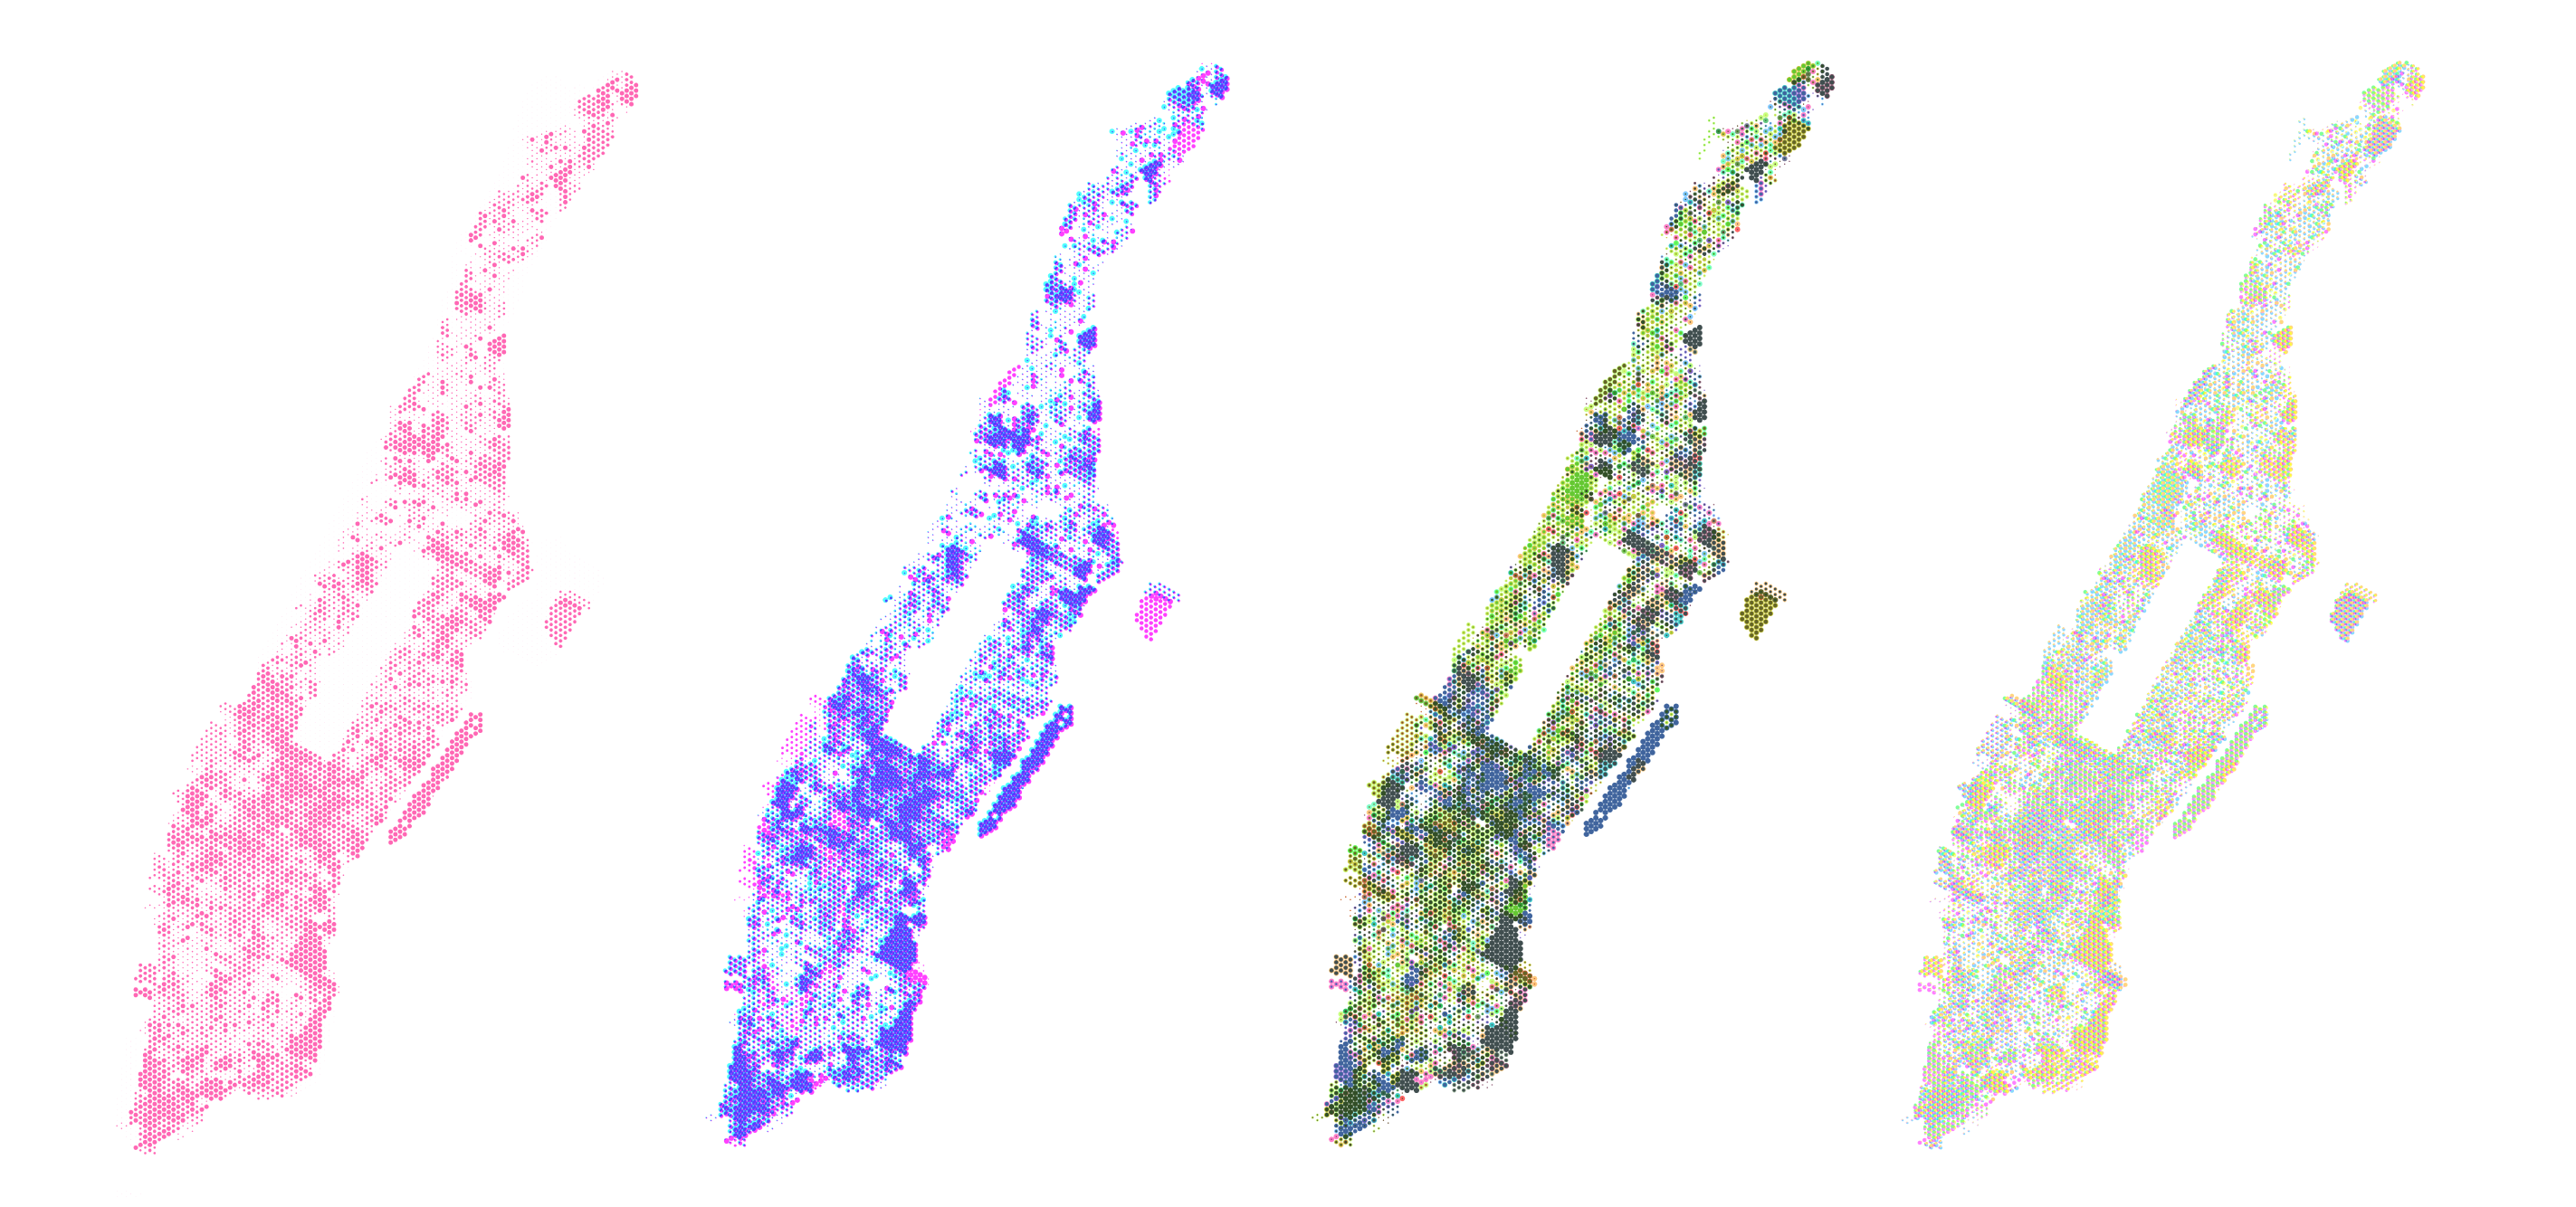
Now that I had the data, the next step was figuring out how to visualize all five materials on a single map. One of my main goals was to make sure users could clearly distinguish and interact with each material layer. At first, I experimented with heatmaps and dot density maps, taking cues from Jia Zhang’s excellent Asian American Dot Density Map,but they didn’t quite translate, either contextually or visually, for mapping building materials.
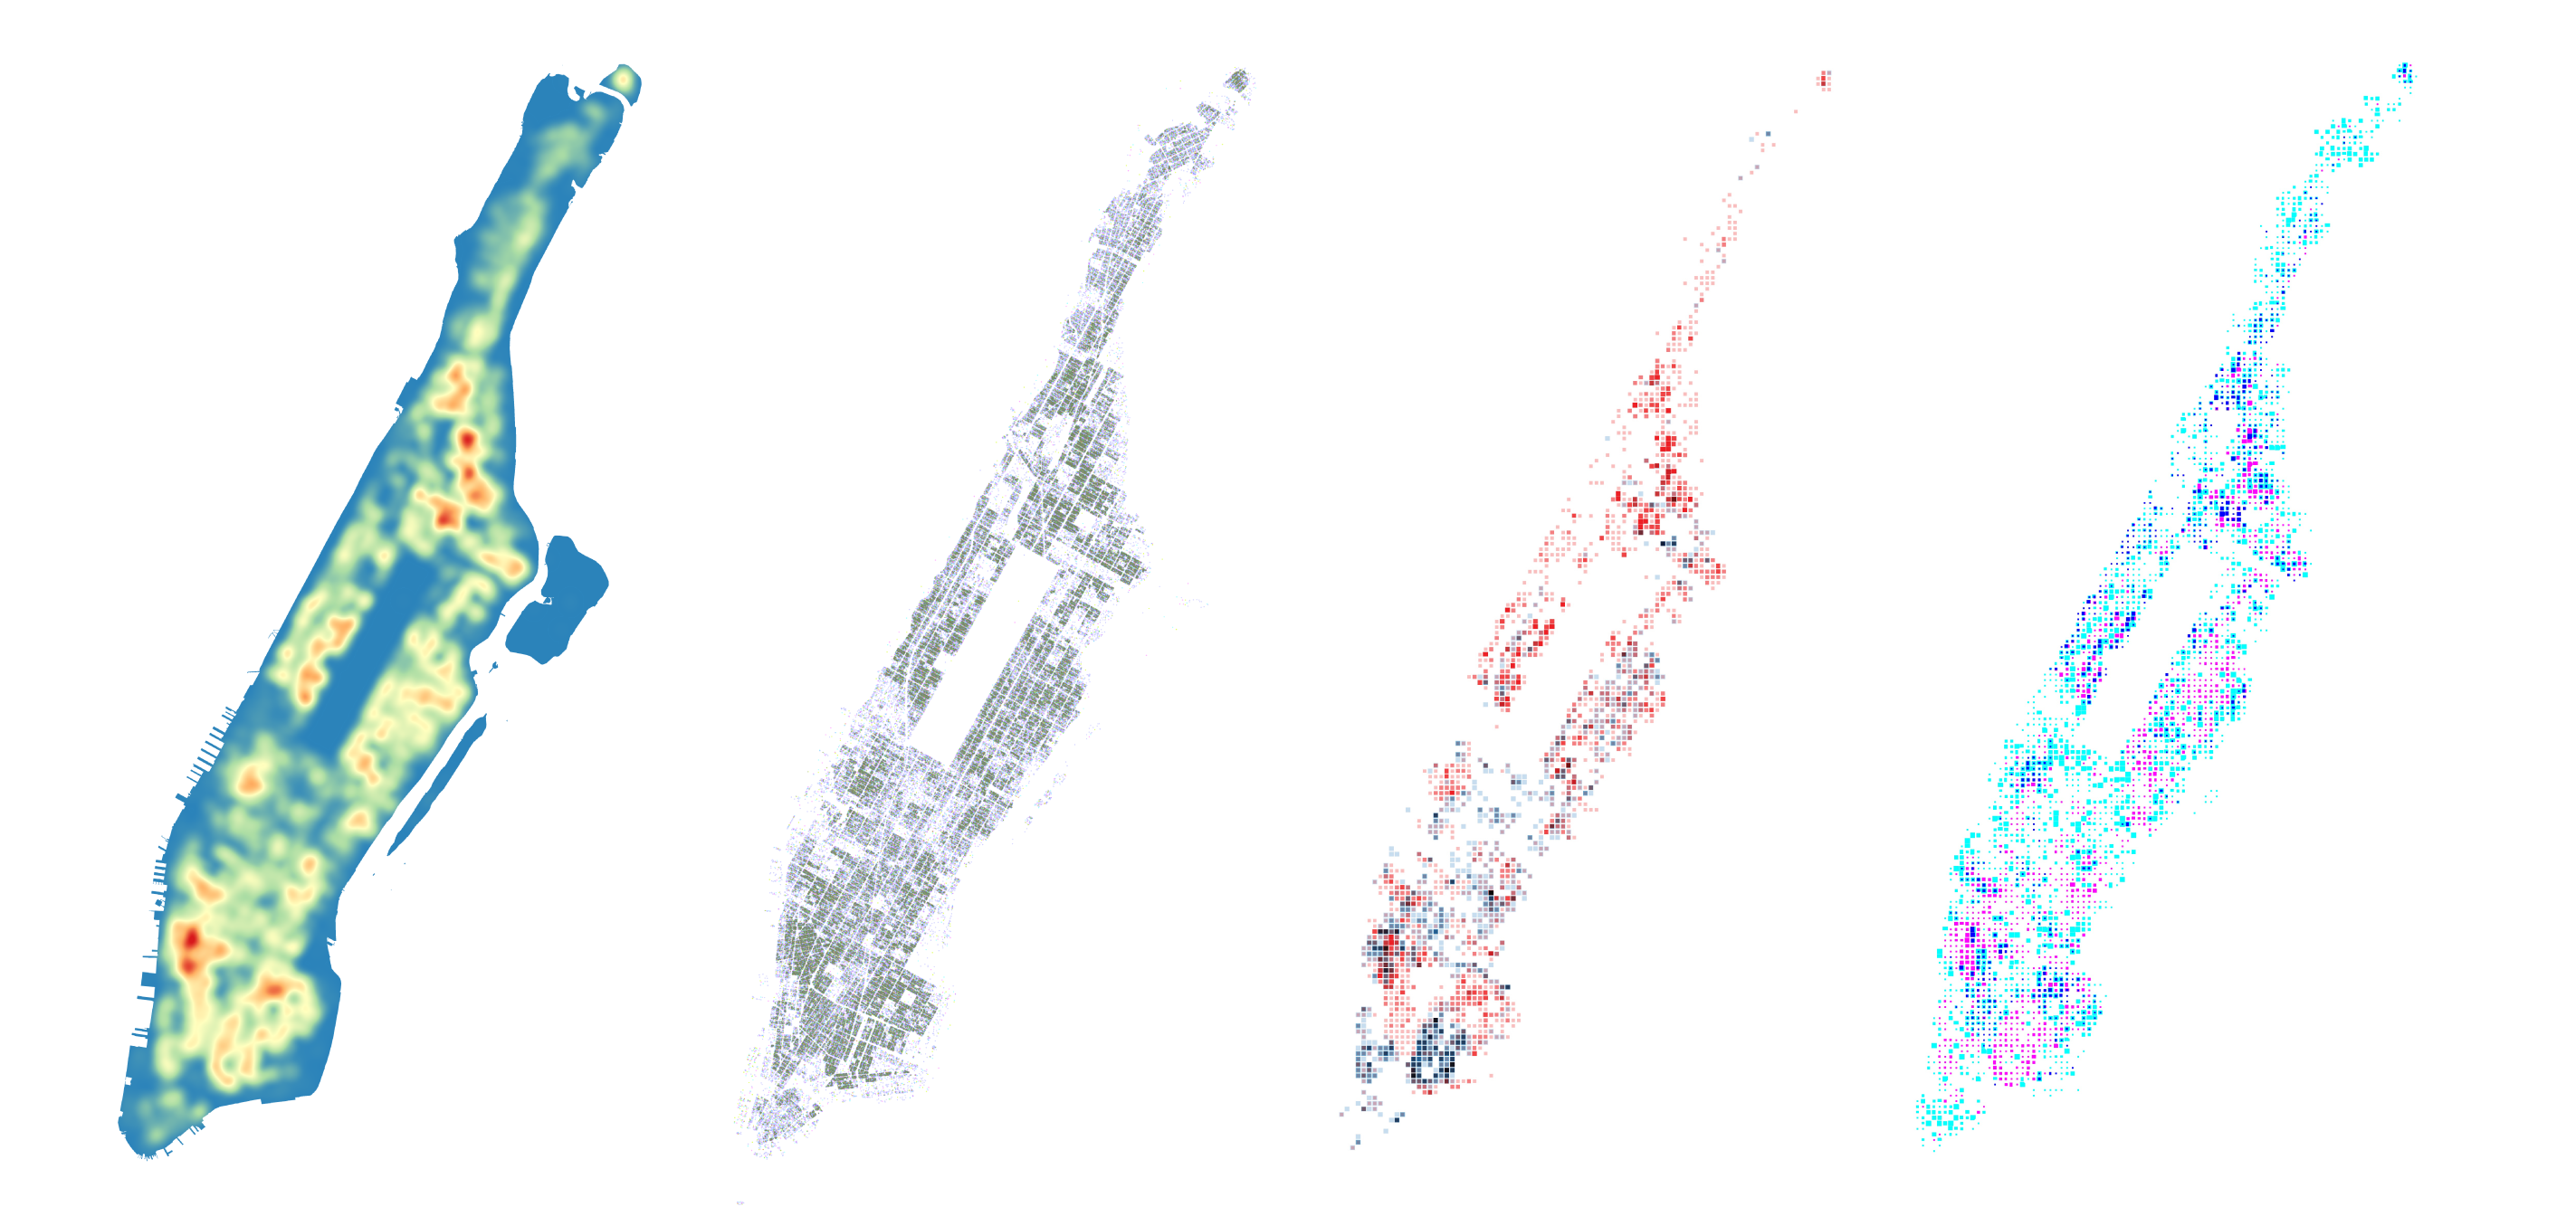
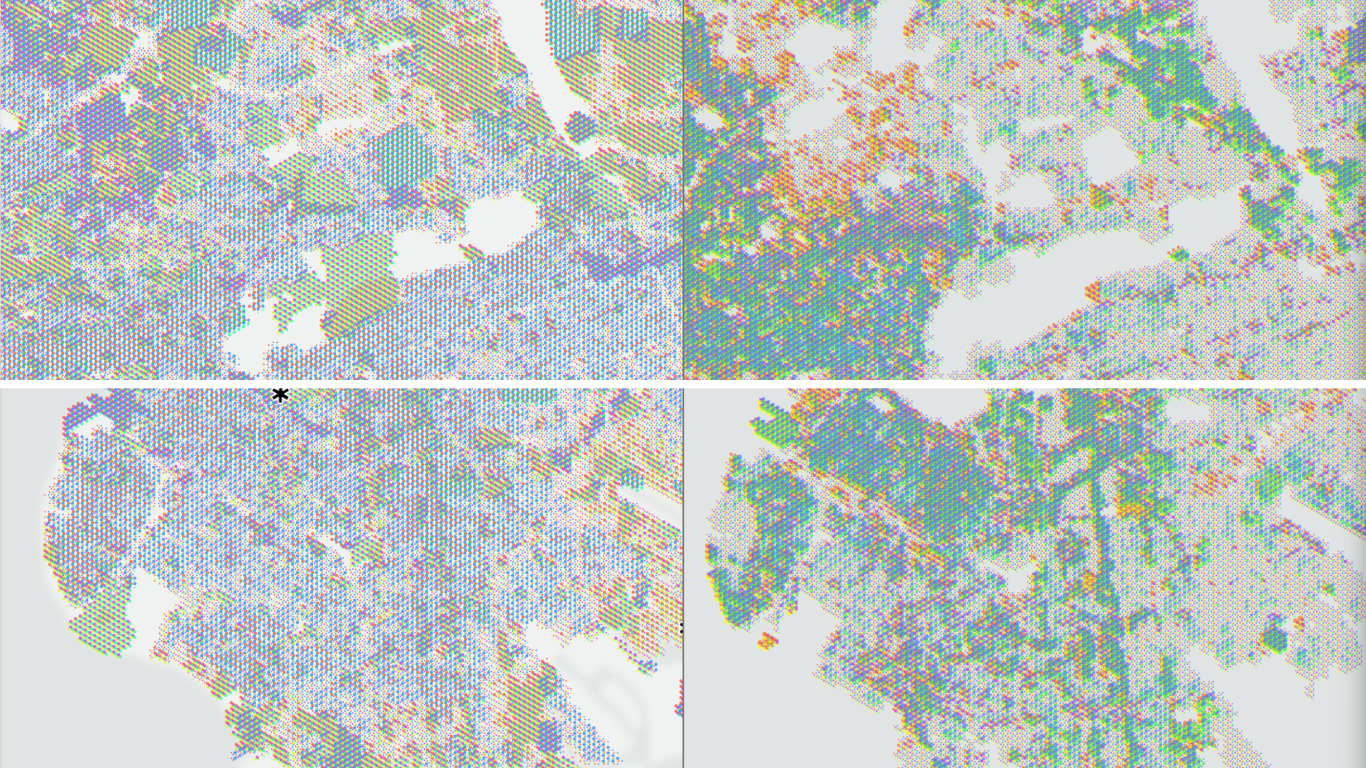
Then, I remembered how Civilization uses hex grids for both gameplay and visualization (old habits die hard,) especially its adjacency mechanics, both on a gameplay and theoretical level. Wanting to emphasize a purely material lens for NYC, and to move away from the rigidity of gridiron layouts from common map visualizations, I settled on a hexagon grid with overlapping dots as the core visual language for this project.
Part 3 of 4: Platform Interactions
Earlier, I mentioned how strategy games influenced this project (by now, it’s probably clear I’m really a huge gamer.) Two UI features that really stood out to me were X-ray views—layer toggles that follow your cursor with a mask—and info panels, which dynamically update based on what feature you’re hovering over. These tools make it easy to compare layers and tiles at a glance, and I wanted to bring that same sense of clarity and interactivity into this platform.
Part 4 of 4: Story Markers
During playtesting, one piece of feedback stood out: users weren’t always sure what the platform was trying to communicate. It lacked enough context and didn’t clearly convey its purpose. That led me to develop a system of ‘story markers’—small, material-themed monikers that feature quotes from The New York Times, tied to the material history of specific regions. These markers reveal their names, backstories, and references on hover, adding a layer of narrative and discovery. They help users explore the distribution of materials and understand the why and how behind them, essentially telling NYC’s story through the lens of what it’s made of.
Who's Behind NYC Building Materials?
Architect & First-time coder with help from a bunch of lovely GSAPP folks.
A Three-Semester Support
I'm Hao Lee, a licensed Taiwanese architect, artist, translator, film enthusiast, and heavy gamer. NYC Building Materials is a project I developed during my Master of Science in Computational Design Practices (M.S.CDP) at Columbia University’s Graduate School of Architecture, Planning, and Preservation (GSAPP). The CDP program is structured around a three-semester core course—Colloquium I, II, and III—which serves as the foundation for developing a capstone project throughout the program.
Over the course of three semesters, I shaped NYC Building Materials from concept to execution. In the first semester, I focused on defining the project's core ideas, while the second and third semesters were dedicated to implementation and refinement. With this structure in mind, I intentionally selected electives that would support and enhance the project.
The electives that directly contributed to NYC Building Materials include, but are not limited to, the following (listed in semester and alphabetical order):
Computational Design Workflows by Celeste Layne;
Computational Modeling by Meli Harvey and Luc Wilson;
Mapping Systems by Mario Giampieri; and
Methods As Practices by William Martin and Violet Whiteney.
Data Visualization For Architecture, Urbanism, and the Humainties by Jia Zhang;
Explore, Explain, Propose by Laura Kurgan and Snoweria Zhang; and
GIS For Design Practices by Dare Brawley and Mario Giampieri.
Design in Action by Catherine Griffiths and Seth Thompson;
Exploring Urban Data with Machine Learning by Jonathan Stiles;
Footprint: Carbon & Design by David Benjamin; and
Spatial Design Narratives by Josh Begley.
References
Material Estimate & Tile Data
Fishman, Tomer, Alessio Mastrucci, Yoav Peled, Shoshanna Saxe, and Bas van Ruijven. 2023. The Regional Assessment of Buildings’ Material Intensities (RASMI). https://doi.org/10.5281/zenodo.10124952.
New York City Department of City Planning. n.d. MapPLUTO Data. Accessed May 2, 2025. https://www.nyc.gov/site/planning/data-maps/open-data/dwn-pluto-mappluto.page.
Carbon Leadership Forum. 2023. Material Baselines for North America (August 2023). https://carbonleadershipforum.org/clf-material-baselines-2023/.
National Historical Geographic Information System (NHGIS). 2020. NYC Census Data (2020). https://data2.nhgis.org/.
New York City Department of Buildings. 2022–2024. NYC Building Energy and Water Data Disclosure for Local Law 84. https://data.cityofnewyork.us/Environment/NYC-Building-Energy-and-Water-Data-Disclosure-for-/5zyy-y8am/about_data.
New York City Department of City Planning. 2020. NYC Census Tracts (2020). https://data.cityofnewyork.us/City-Government/2020-Census-Tracts-Mapped/weqx-t5xr.
Lerner, Sam (Dreamer). n.d. NYC Neighborhoods Map. Accessed May 2, 2025. https://www.google.com/maps/d/u/0/viewer?mid=1c8sYYoYTy-_b7ml3O5Y5ArkS3eRM1W0&ll=40.73677714231287%2C-73.8026375970926&z=14.
Marker Shapes & Background
New York City Department of Parks and Recreation. n.d. Parks Properties. https://nycopendata.socrata.com/Recreation/Parks-Properties/enfh-gkve/about_data.
New York State GIS Resources. n.d. New York State Civil Boundaries. https://gisdata.ny.gov/GISData/State/Civil_Boundaries/NYS_Civil_Boundaries.shp.zip.
New Jersey Office of Information Technology, Office of GIS (NJOGIS). n.d. NJ Counties. https://njogis-newjersey.opendata.arcgis.com/datasets/middlesexcounty::nj-counties/about.
X-Ray Layers
New York City Department of City Planning. n.d. NYC GIS Zoning Features. https://www.nyc.gov/site/planning/data-maps/open-data/dwn-gis-zoning.page.
Metropolitan Transportation Authority. n.d. NYC Subway Lines. https://data.cityofnewyork.us/Transportation/Subway-Lines/3qz8-muuu.
University of Texas at Austin, Texas GeoData Portal. n.d. 2019 LIRR Routes & Stops; 2019 Metro-North Routes & Stops; and 2017 PATH Train Routes & Stops. https://geodata.lib.utexas.edu/?f[dct_isPartOf_sm][]=NYC+Mass+Transit+Spatial+Layers&page=2.
GIS Lab, Newman Library, Baruch College (CUNY). 2019. New York City Bus Routes, December 2019. https://archive.nyu.edu/jspui/handle/2451/60058.
New York City Department of City Planning. 2025. DCM Arterials and Major Streets, March 2025. https://hub.arcgis.com/datasets/DCP::dcm-arterials-and-major-streets/about.
Kevin Brown. n.d. New York City Bus Stops by New York Startup Index. GitHub. https://github.com/kevin-brown/nyc-open-geojson/blob/master/transportation/bus-stops.geojson.
Most, if not all, of this project is built on open data. Without the availability of pre-existing data and online documentation, at least 95% of my development time would have been spent on field research alone. While field research is invaluable, relying solely on it would limit the possibilities of creating a comprehensive computational project within just three semesters at Columbia. To me, one of the greatest strengths of America’s scientific community is its commitment to transparency and the willingness to investigate and document data. This openness to sharing information has not only fueled scientific and creative breakthroughs but also played a crucial role in uncovering and combating social injustices and inequalities. With NYC Building Materials, I aim to honor the government bodies, non-profits, academics, and individuals who contribute to this vital data-sharing ecosystem. It is through their dedication to open data that we can drive progress and stability.
Karl Popper, The Logic of Scientific Discovery (London: Hutchinson, 1959), 23. ↩︎
Ian McHarg, “Processes as Values,” in Design with Nature (New York: Wiley, 1970), 102–115. ↩︎
Anthony Dunne and Fiona Raby, Speculative Everything (Cambridge, MA: MIT Press, 2013), 1–47. ↩︎
Yanni Loukissas, “From Data Sets to Data Settings,” in All Data Are Local (Cambridge, MA: MIT Press, 2019), 1–24. ↩︎
Waldo Tobler, “A Computer Movie Simulating Urban Growth in the Detroit Region,” Economic Geography 46, no. S1 (1970): 234–240. ↩︎