Predicting NYC Lifelines
Xiaoya Wang
Project Description
Predicting NYC Lifeline is a platform that allows users to explore block group-level life expectancy in New York City, predicted using machine learning in research. The platform consists of two main parts: one for displaying the predicted life expectancy, and another for scoring areas based on user-selected factors.
The life expectancy display section combines data visualization with user interaction. By clicking on a block group of interest, an info panel appears showing detailed information about the selected area and its neighboring areas, while simultaneously highlighting them on the map.
For the scoring section, users can drag different factors into the text box on the left, and the system will score each area based on the values of these user-selected factors and their degree of influence on life expectancy. Areas with the highest score will be highlighted and the score of the selected area will be displayed when it is clicked.
Why Choose Life Expectancy And Machine Learning
Life expectancy is a value that refers to the average number of years a person is expected to live and a key indicator of the overall health level of a region, always used to design targeted policies in healthcare by governments. Closely linked to individual health conditions, life expectancy is an important metric.
Traditionally, it is calculated using a life table based on age-specific mortality rates and the probability of dying at each age. But since life expectancy is highly related to health, there must be some significant patterns between different factors and life expectancy. There are various types of indicators that can have an impact on health. Maybe life expectancy could not only calculated by mortality rates, but also estimated based on specific factors.
So I introduced an algorithm called Random Forest Regression to predict life expectancy. Using machine learning enables us to move beyond traditional mortality-based models and uncover hidden patterns among a wide range of indicators. Random Forest, in particular, can capture complex, nonlinear relationships and assess the combined influence of different factors on life expectancy at a fine spatial scale.
Why Choose Block Group
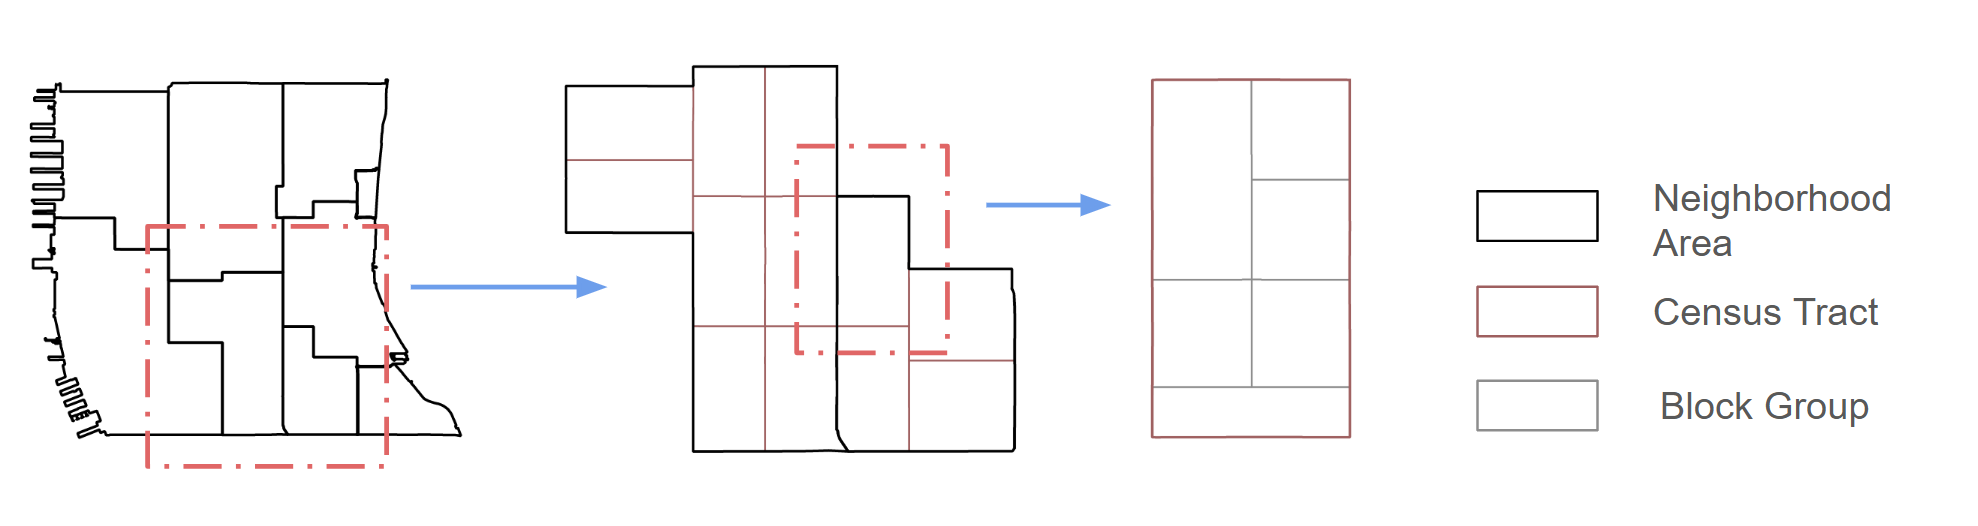
A block group is a cluster of census blocks and a subdivision of a census tract. It is a geographic unit used by the U.S. Census Bureau, typically containing between 600 and 3,000 people, and represents the smallest geographic level at which many census statistics are published.
Smaller geographic levels allow for a much finer and more detailed understanding of regional disparities. However, during the last semester, while analyzing life expectancy across various regions, I observed that most datasets are released at the national, state, or county level, with census tract-level data only available for 2015. Therefore, I chose to predict life expectancy at the block group level to provide more granular insights that can better inform the health conditions of different areas and make public more accessible to life expectancy.
Process of Building The Predictive Model
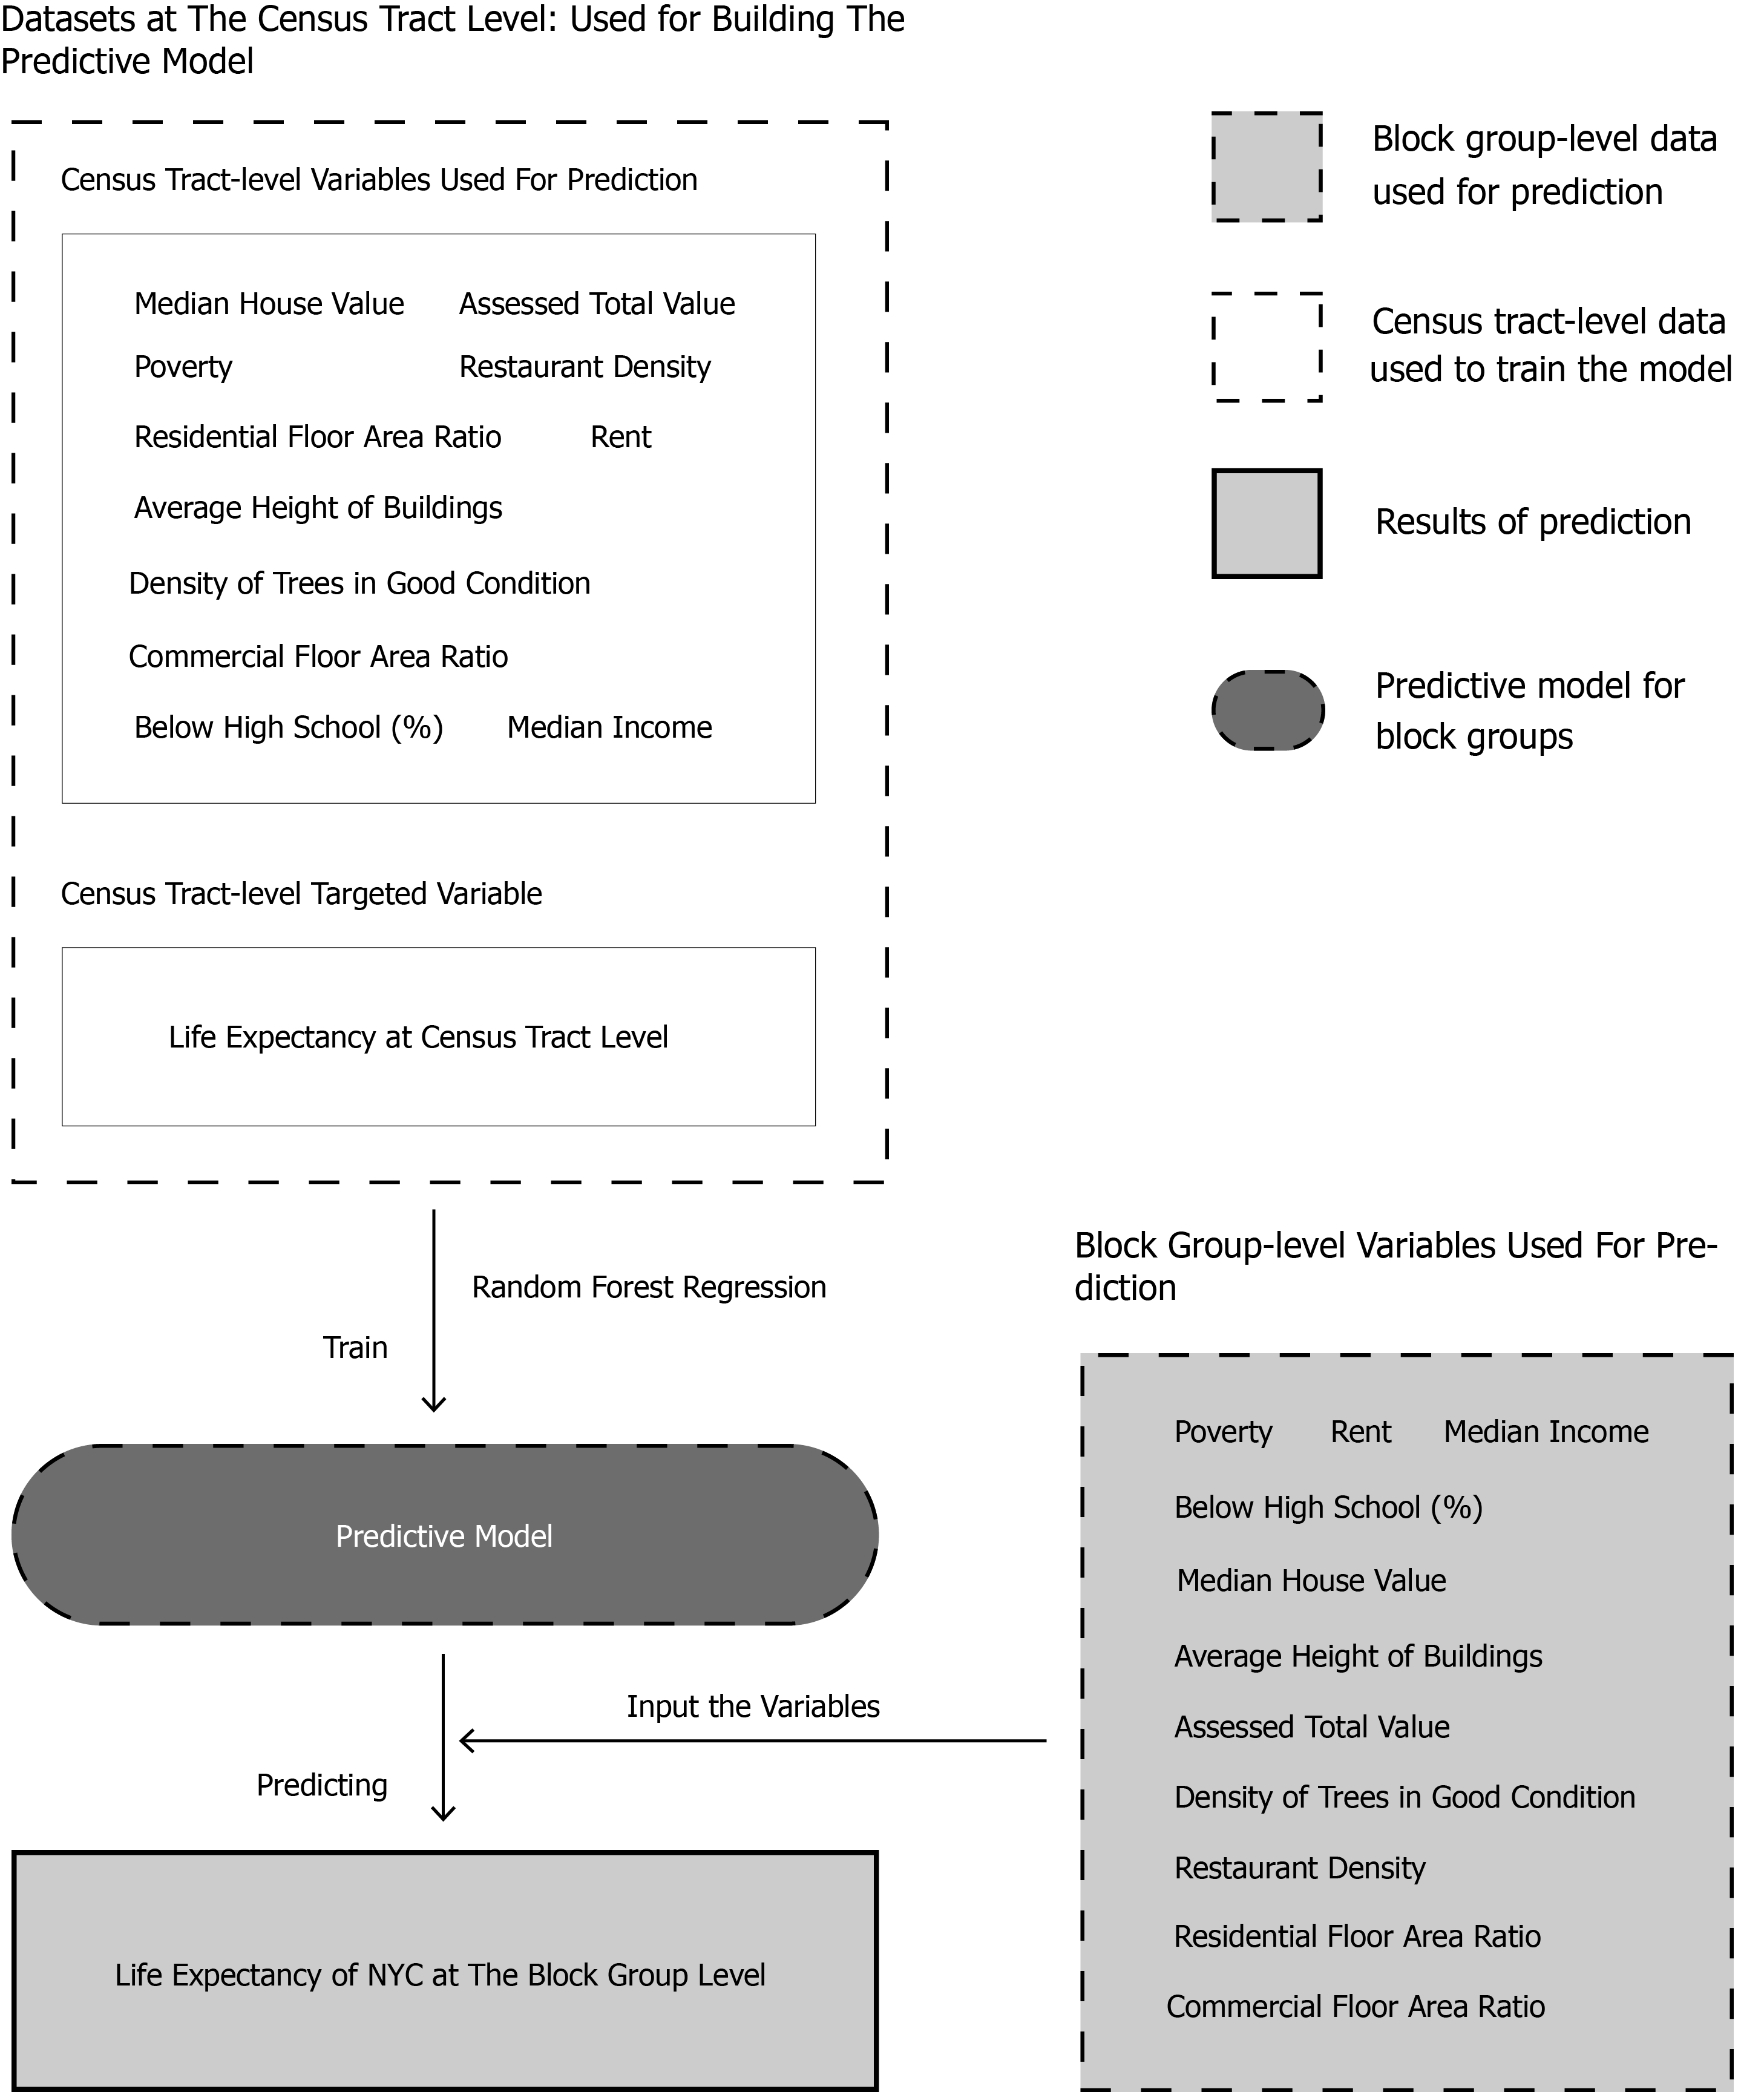
The model is trained using census tract-level data, where life expectancy values are available. A set of explanatory variables—such as poverty rate, median income, assessed total value, building height, and tree density—are used alongside the life expectancy at the census tract level to train a Random Forest Regression model.
Once the model is trained, the same set of variables—this time collected at the block group level—is input into the predictive model. Since life expectancy data is not available at the block group level, the trained model is used to estimate it based on the relationships it learned from the census tract-level data. This allows for generating fine-grained life expectancy predictions, offering a more detailed understanding of health disparities across neighborhoods.
Part 1 of The Platform: How Life Expectancy Values Get Displayed
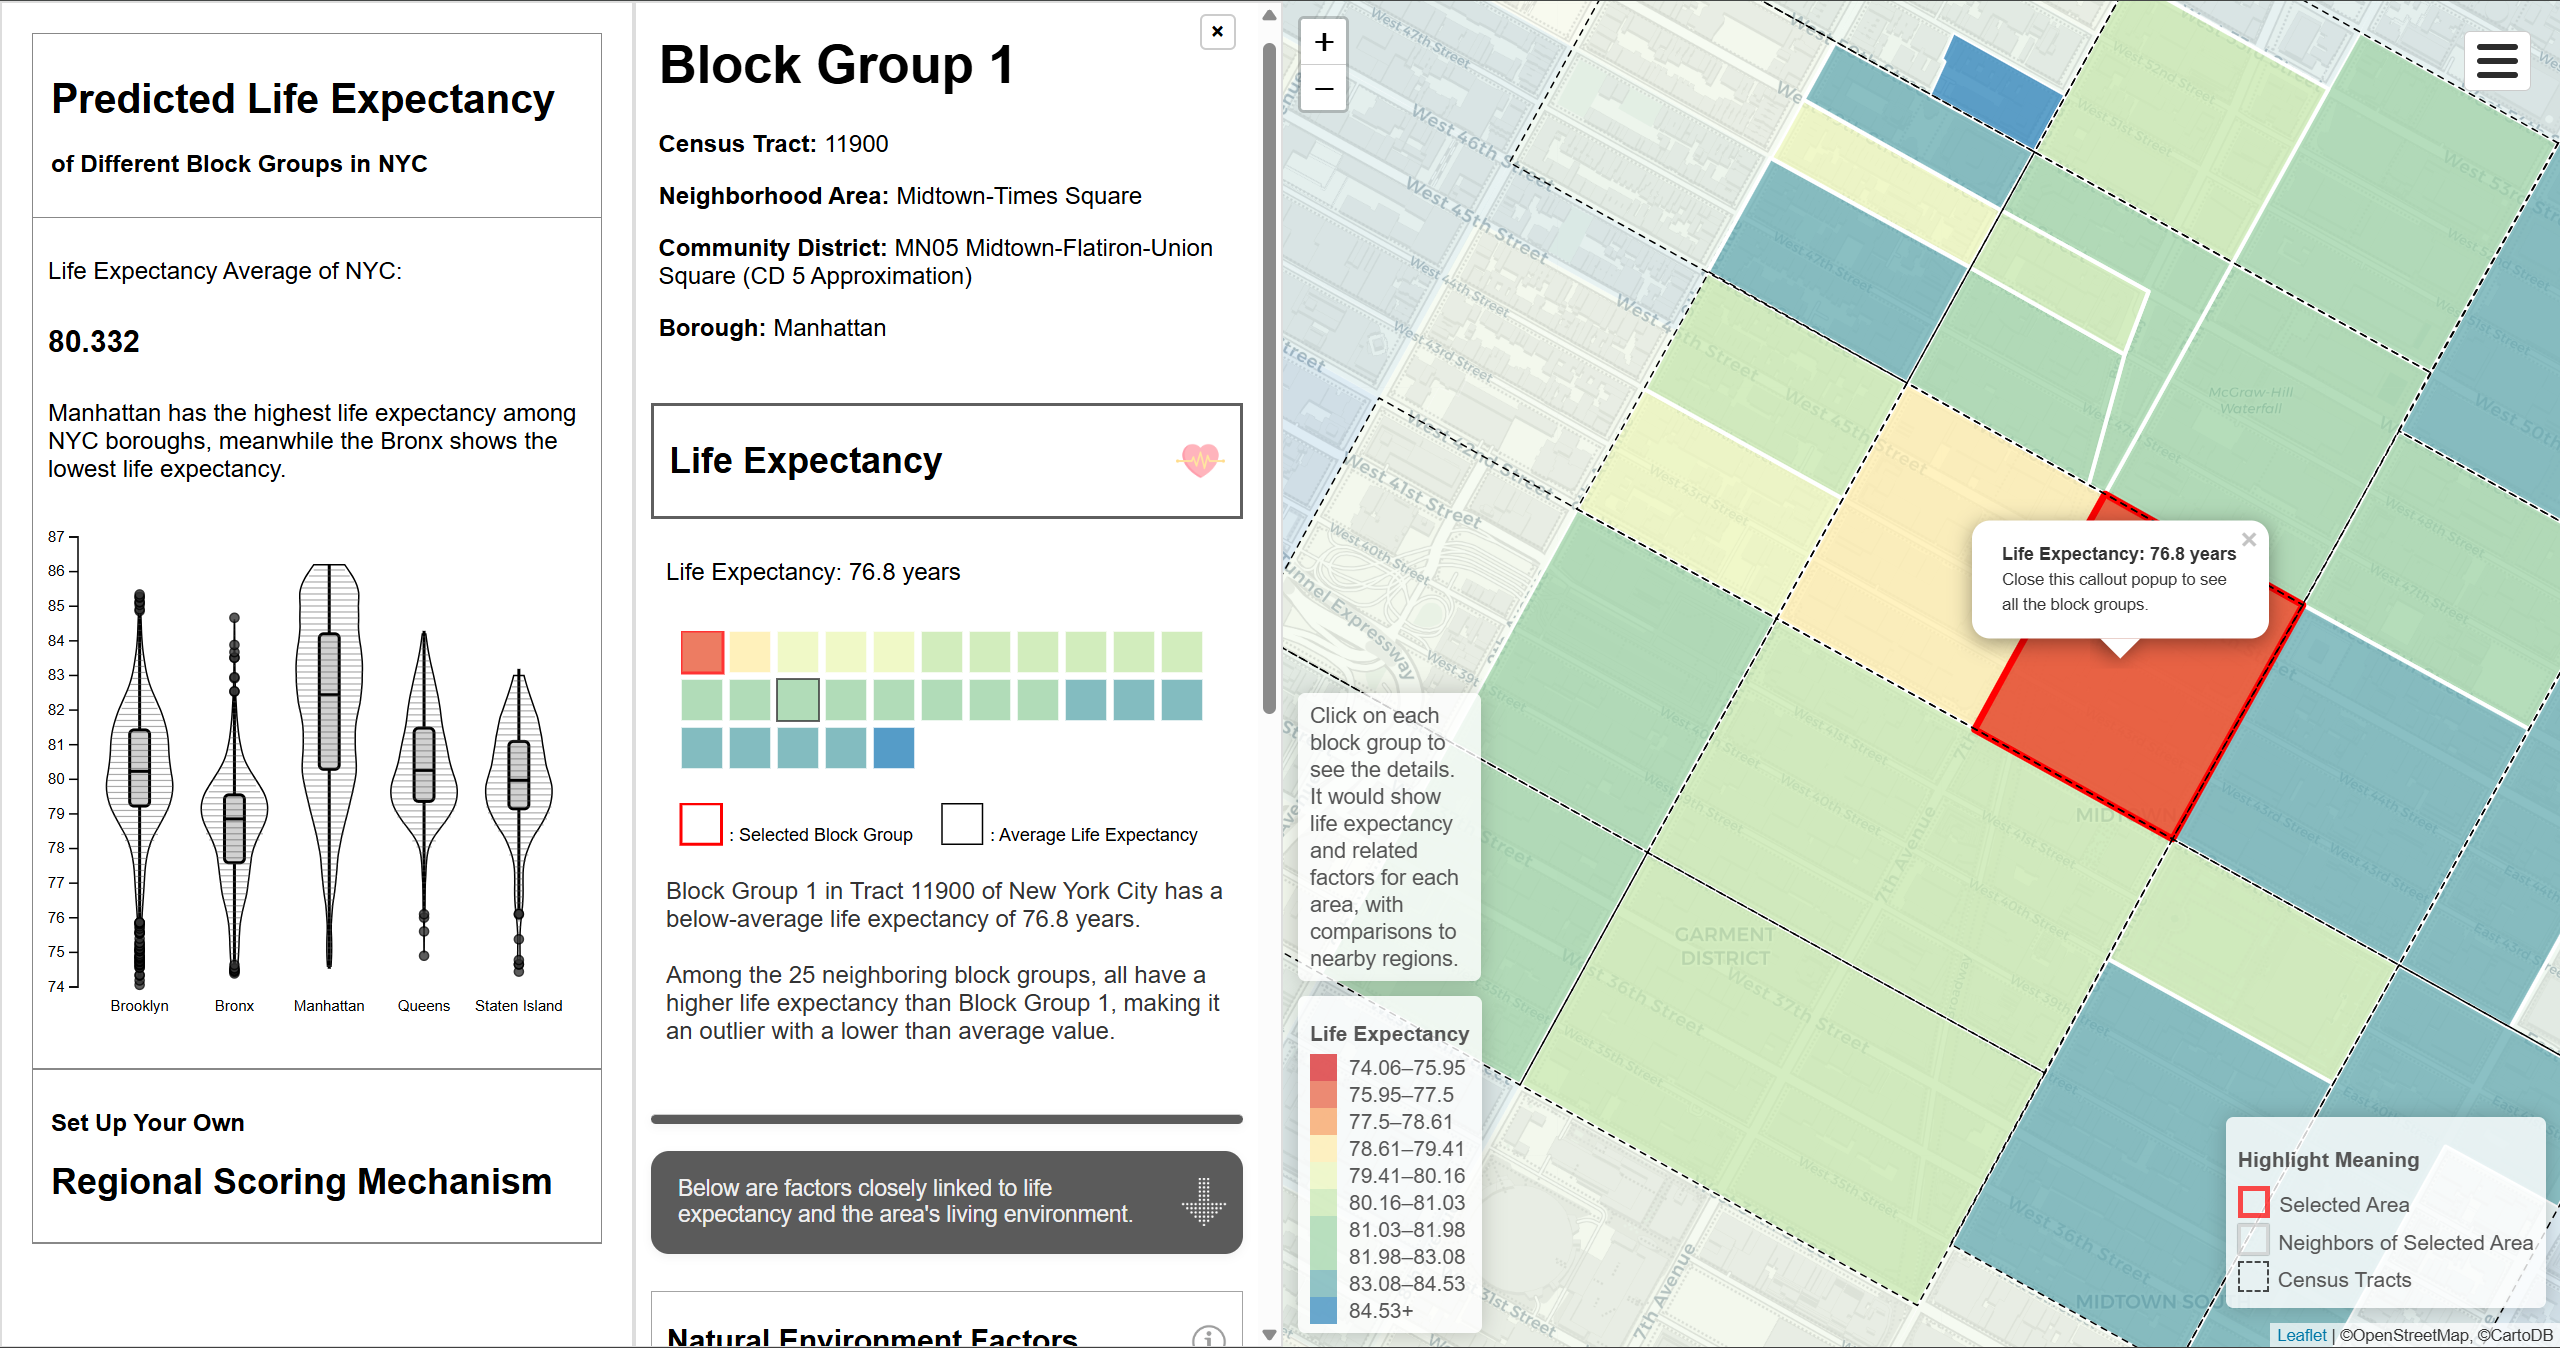
The info panel appearing upon clicking a region shows the life expectancy value of selected area and its neighbors, various factors that both reflect living environments and are highly associated with life expectancy, including natural environment factors, built environment factors and socioeconomic factors.

The life expectancy values of the selected area and its neighboring areas are displayed in the form of a grid heatmap. Each square represents a specific area, and the color indicates its life expectancy. For the visualization of different factors, the treemap was chosen as the visualization type to present the data, where each rectangle represents an area. A backend server was built to integrate OpenAI API, automatically generating the introduction of this selected area, identifying interesting pattern between life expectancy and different factors, and comparing this selected block group with its neighbors.
Part 2 of The Platform: How The Scoring System Works
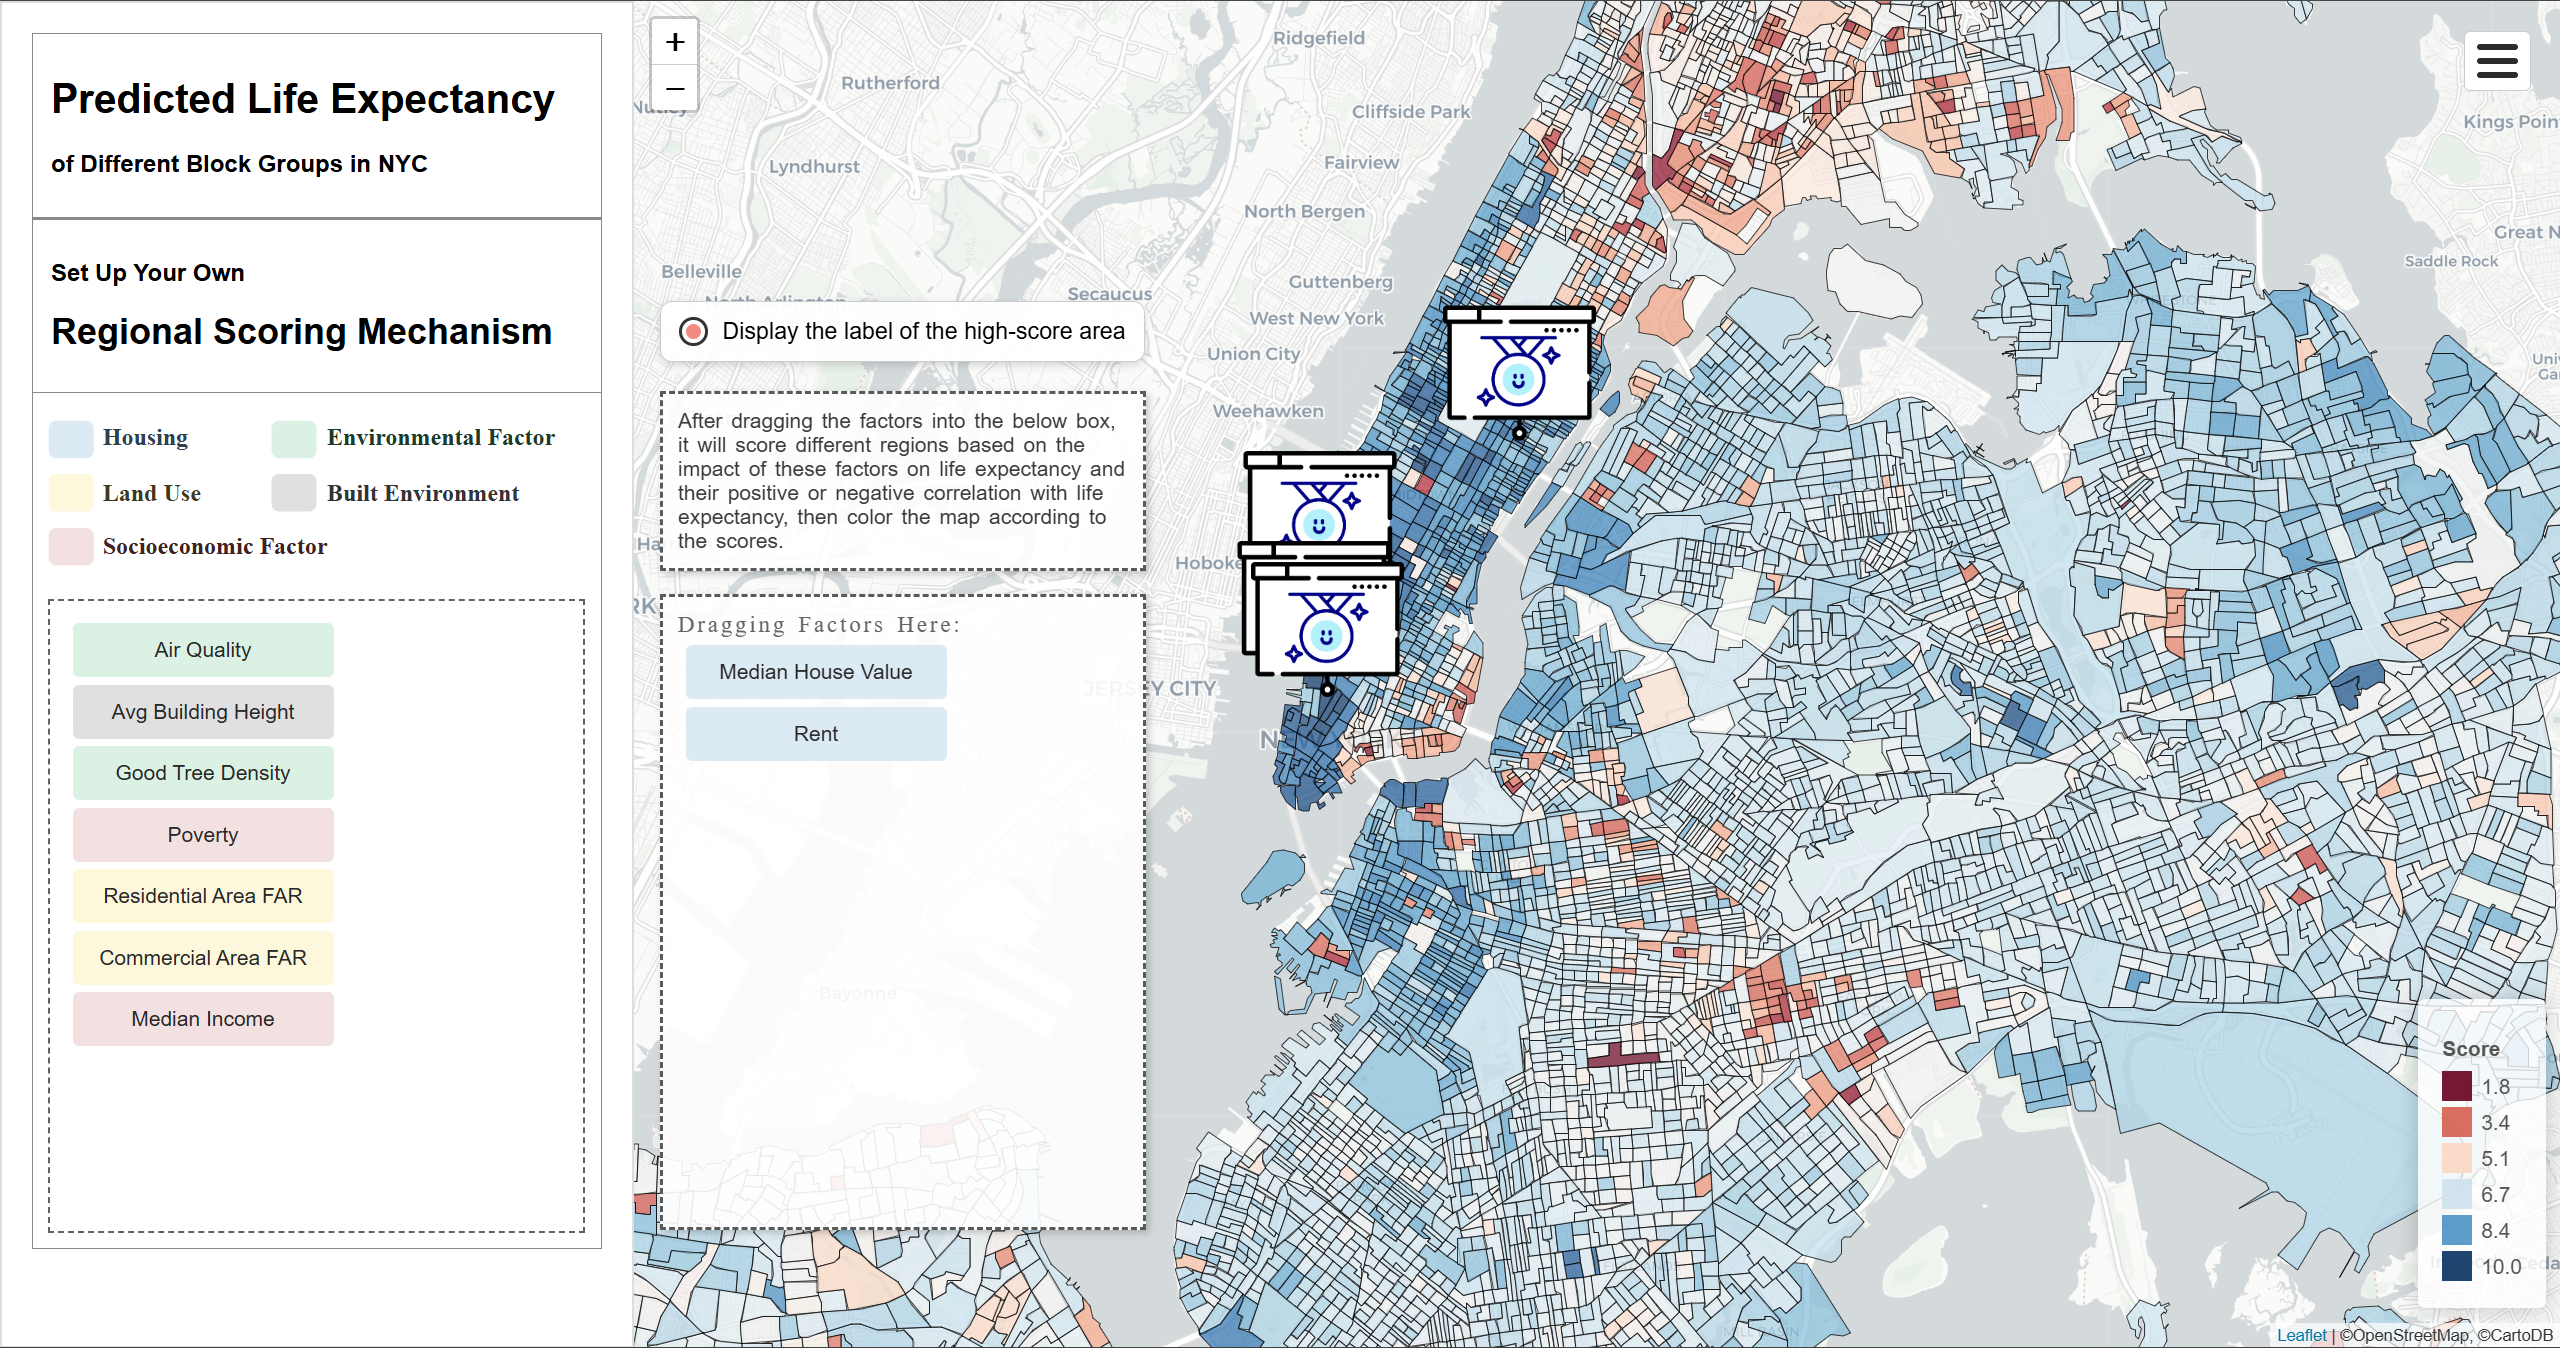
It evaluates all block groups in NYC based on how strongly the user-selected factors influence life expectancy. Each of the block group will be color-coded based on its score, and higher score means healthier condition and higher life expectancy.
During the scoring process, each area starts with 5 points. Since the values of each factor vary significantly, normalization is performed by measuring how far each area’s value deviated from the median value across all regions in NYC. Each normalized factor is then multiplied by its corresponding weight. These weighted values are summed and divided by the total sum of weights to obtain a weighted average. The result is then multiplied by 5 and added to the base score, producing the final score for each area. Since the types and number of factors are constantly changing, this process of calculation is performed in the browser's background, and the resulting scores are then visualized on the map.
Data Source
https://opendata.cityofnewyork.us/
https://experience.arcgis.com/experience/6a3da7b920f248af961554bdf01d668b/page/Access-to-Resources
https://www.cdc.gov/nchs/data-visualization/life-expectancy/index.html
https://www.nyc.gov/content/planning/pages/resources/datasets/mappluto-pluto-change