The Grocery Link
Kitae Kim
This project originated from the concept of fresh food accessibility. This topic has been extensively researched under the term 'food desert' and is a critical issue directly affecting people's life. As part of my studies in the Master of Computational Design Practices program, I explored this societal challenge using computational methodologies to develop data-informed approaches that address the accessibility issues within food desert communities.
Introduction: Redefining Food Accessibility
Food accessibility remains a critical challenge affecting millions of Americans across the country. While the concept of "food deserts" has guided research and policy for years, The Grocery Link project introduces a more comprehensive framework by examining the intersection of traditional food deserts and the emerging landscape of grocery delivery services. This project originated from recognizing that fresh food accessibility is more complex than commonly understood. When policymakers approach this multifaceted issue, they face difficult decisions about prioritization and intervention strategies, especially when working with limited resources to maximize impact.

The Scope of the Problem
Previous research has primarily focused on physical grocery store locations, but The Grocery Link project demonstrates the necessity of also considering delivery services, which have become essential in modern society. Even for those living in food deserts, access to grocery delivery could significantly alleviate food accessibility issues. However, areas facing both constraints simultaneously experience a much more severe food access crisis, with residents inevitably traveling long distances to obtain fresh food.
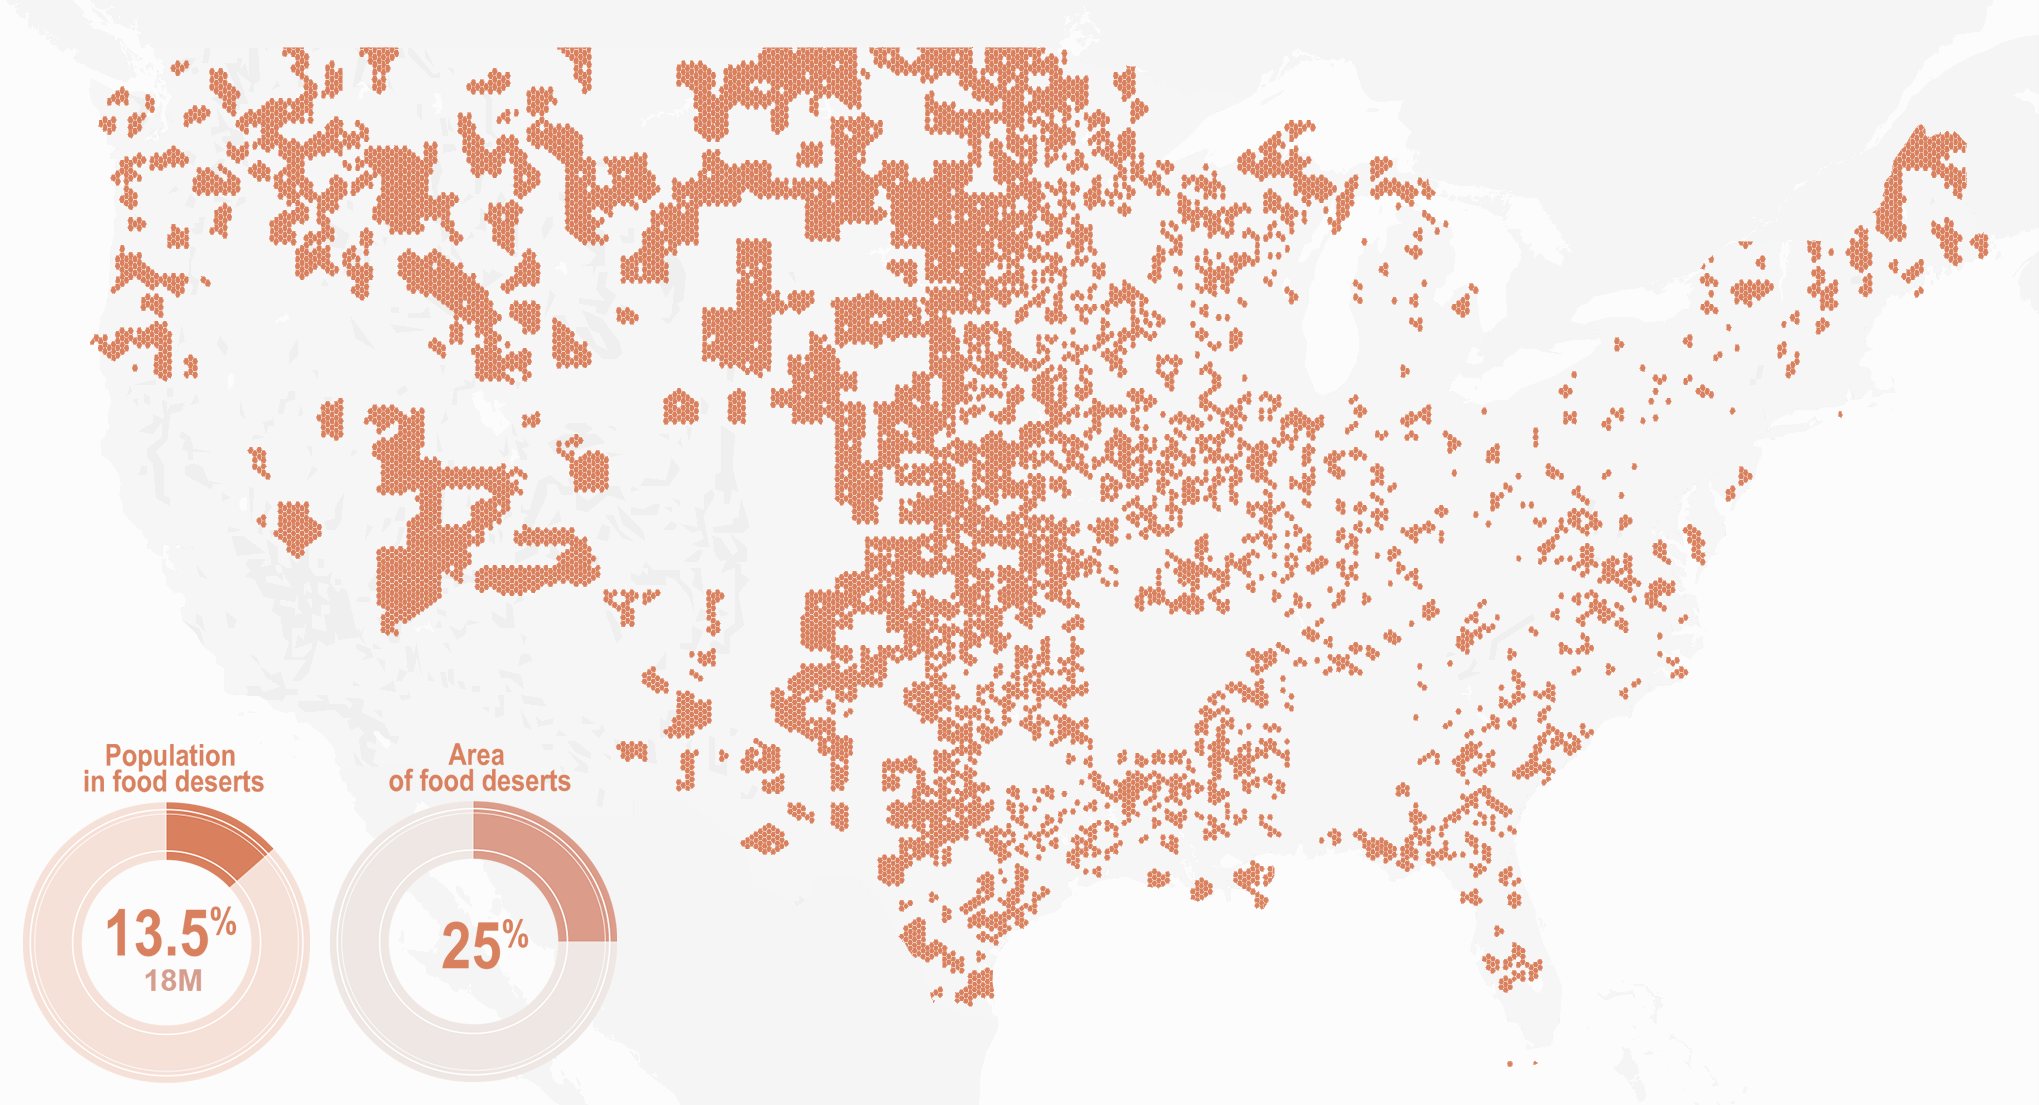
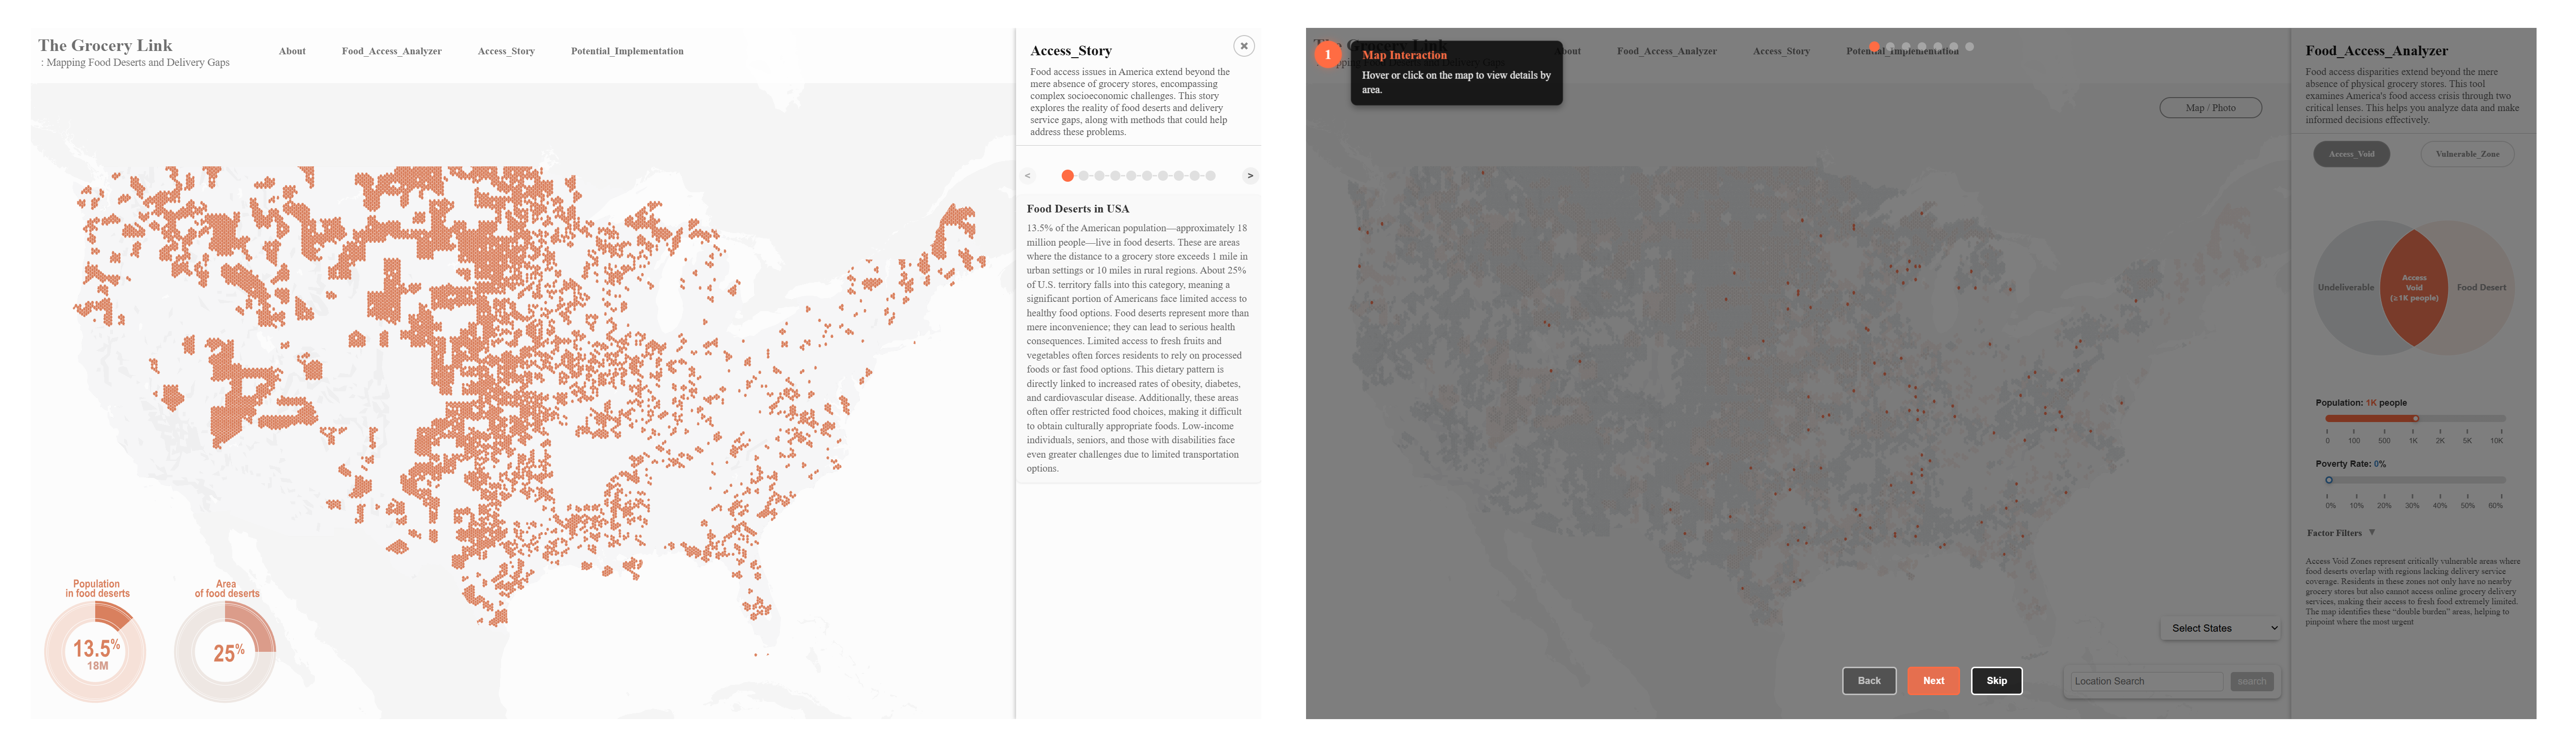
Traditional Food Desert Mapping
Food Deserts are areas where access to fresh, nutritious food is limited due to distance from grocery stores. Currently, about 25% of U.S. area lacks grocery stores selling fresh food within 1 mile in urban areas and within 10 miles in rural areas. Approximately 13% of the U.S. population lives in these food deserts.
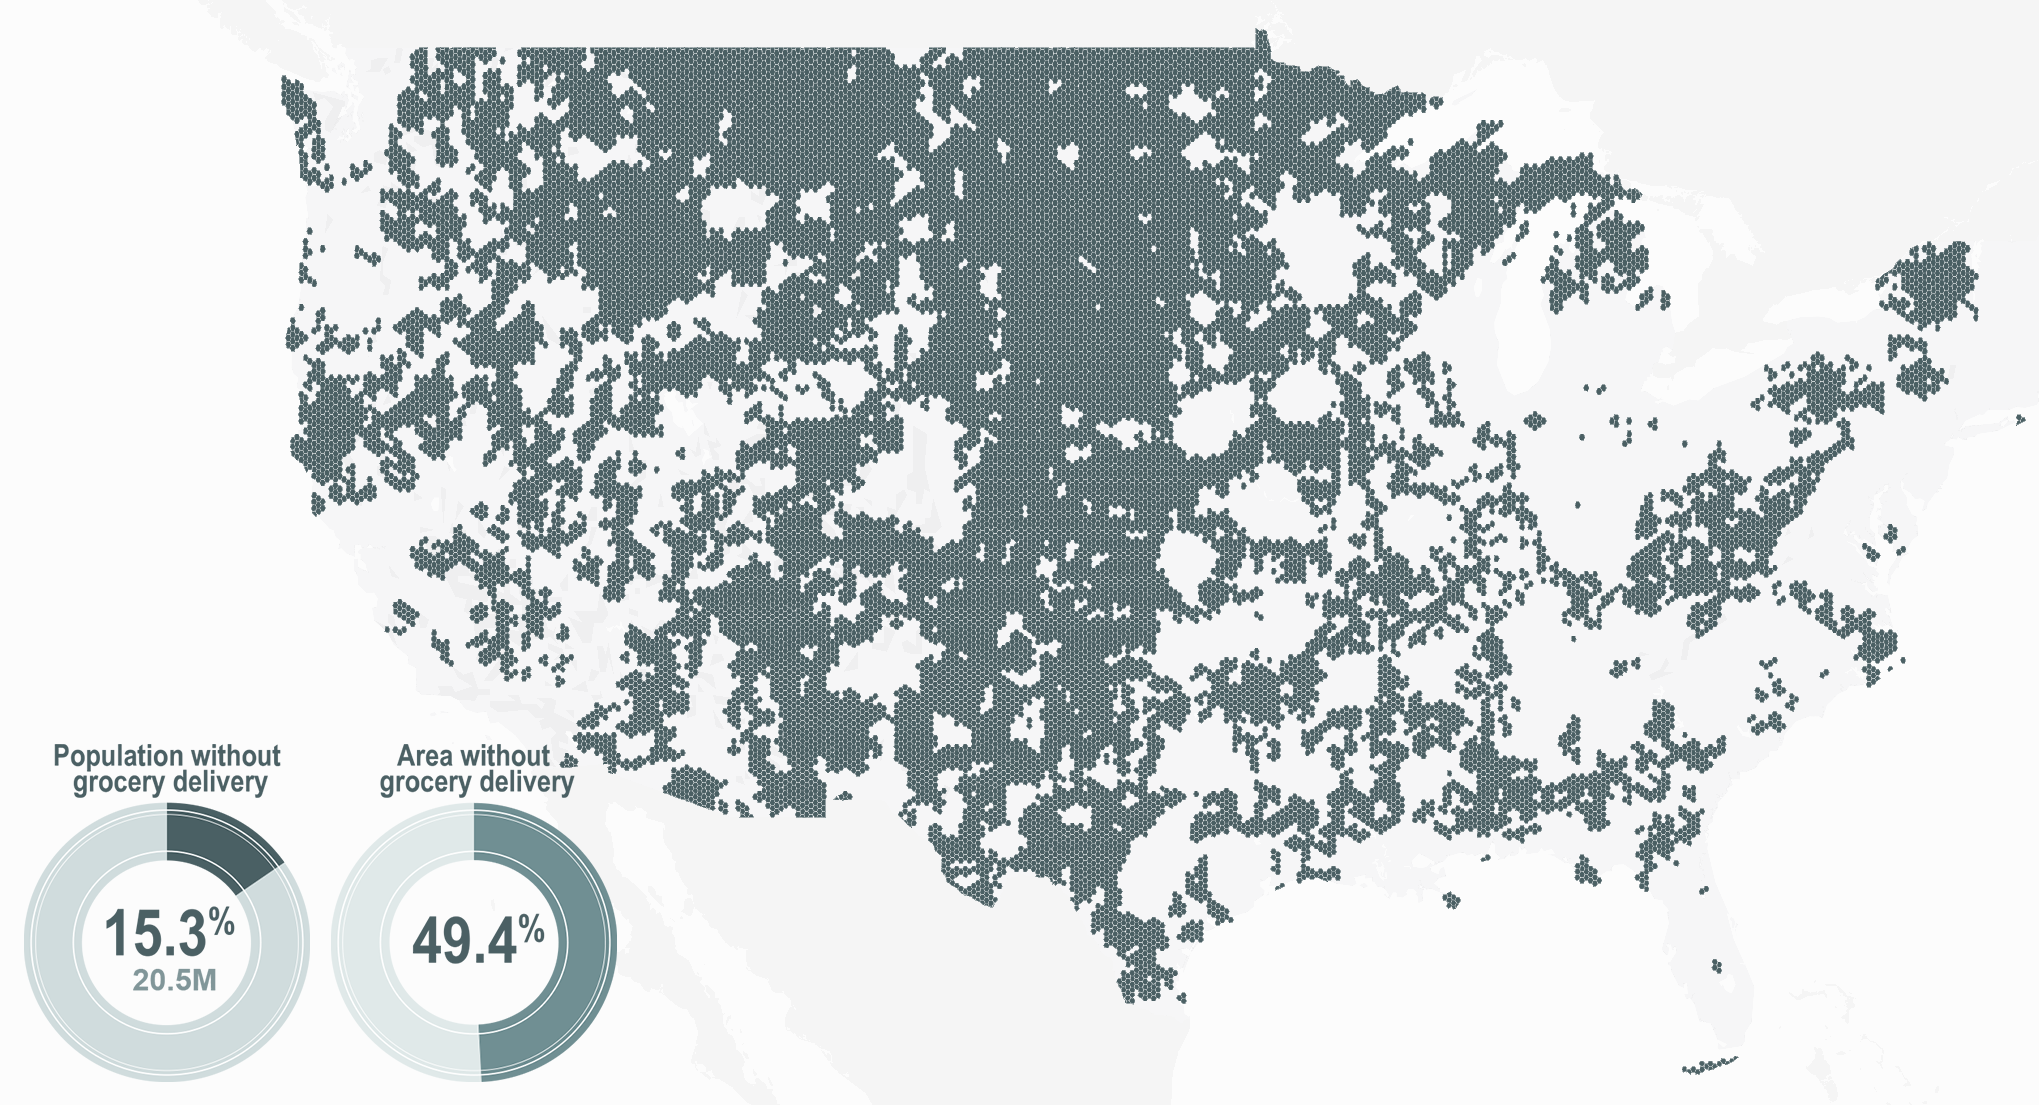
Grocery Delivery Service Coverage
Regions beyond the typical 10-miles service radius of grocery delivery providers. Despite widespread delivery services from grocery markets across the U.S., many areas outside these boundaries can't access delivery options. Almost half of U.S. area cannot access grocery delivery services, affecting 15% of the total population.
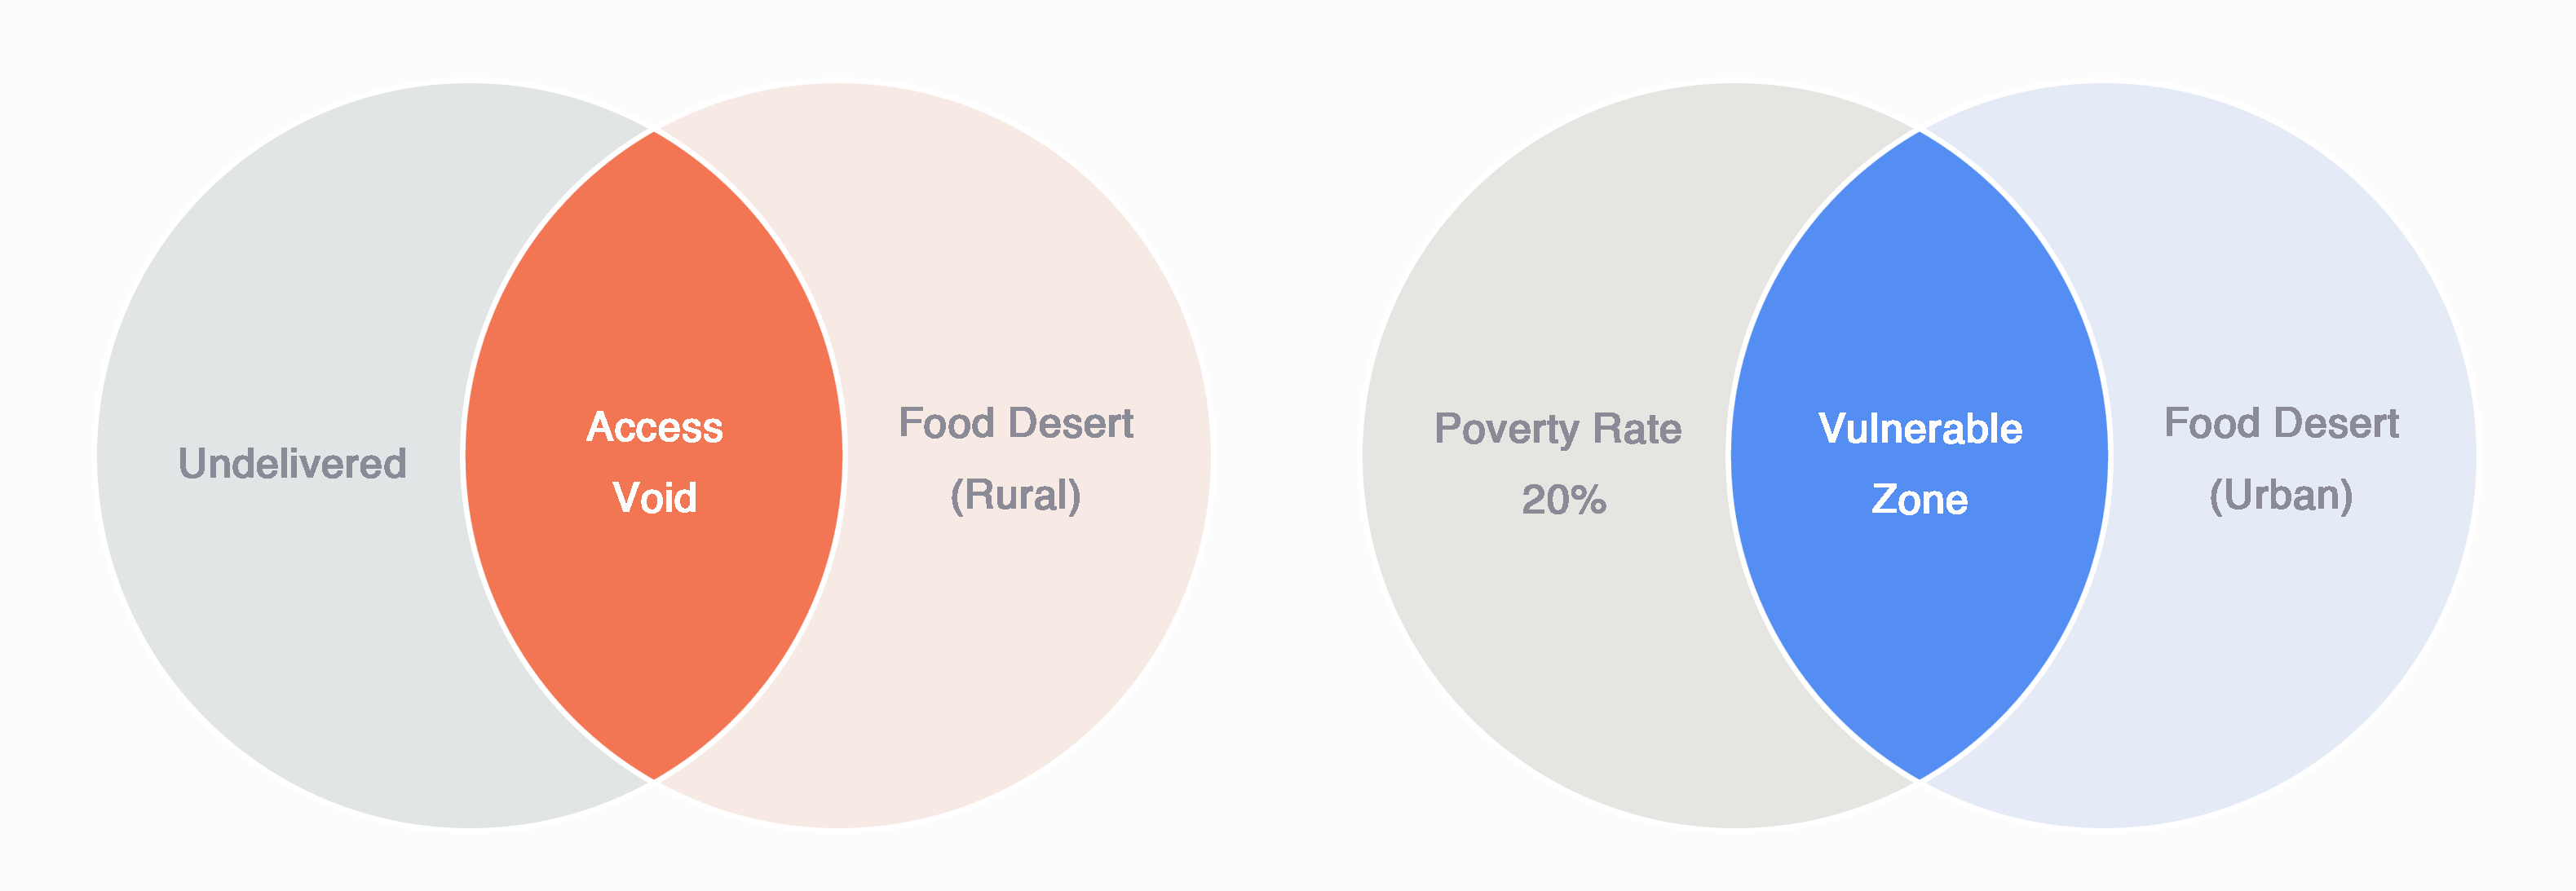
Priority Food Access Areas
Through data analysis, I identified two types of areas
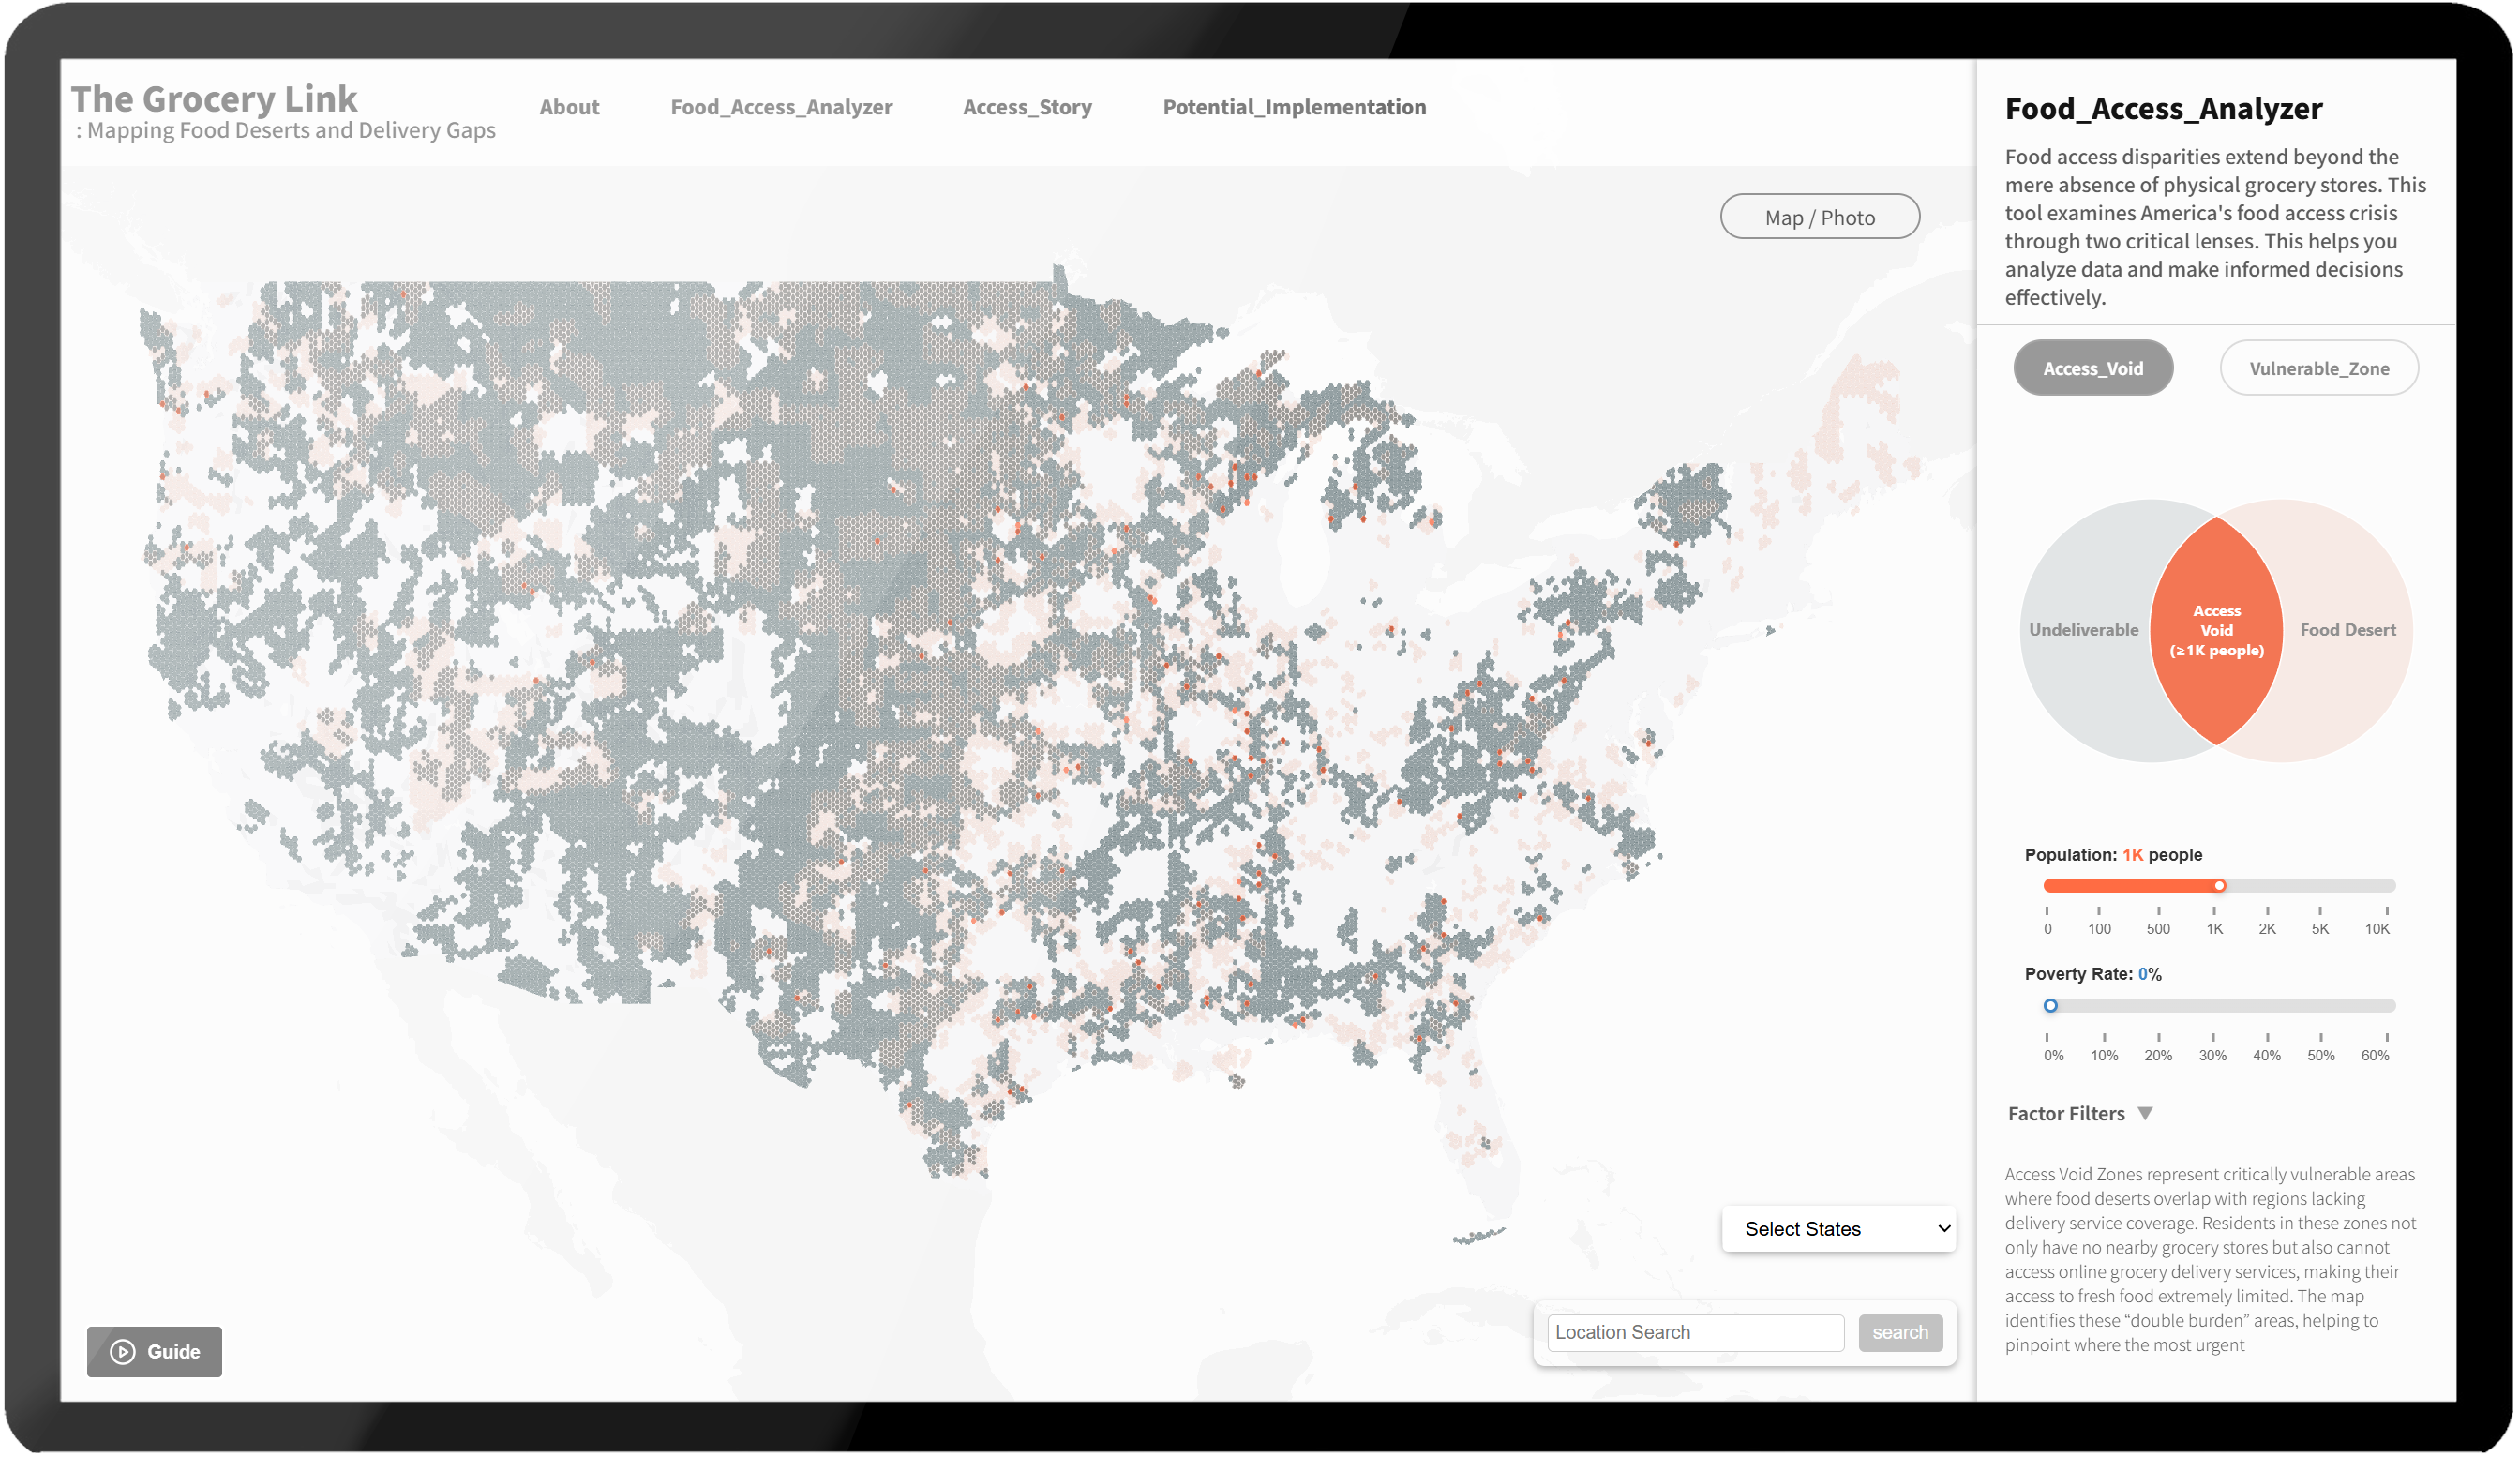
First, "Access Void" refers to regions that are both food deserts and excluded from grocery delivery service areas. Over 100 communities with 1000 populations face these dual constraints across the United States.
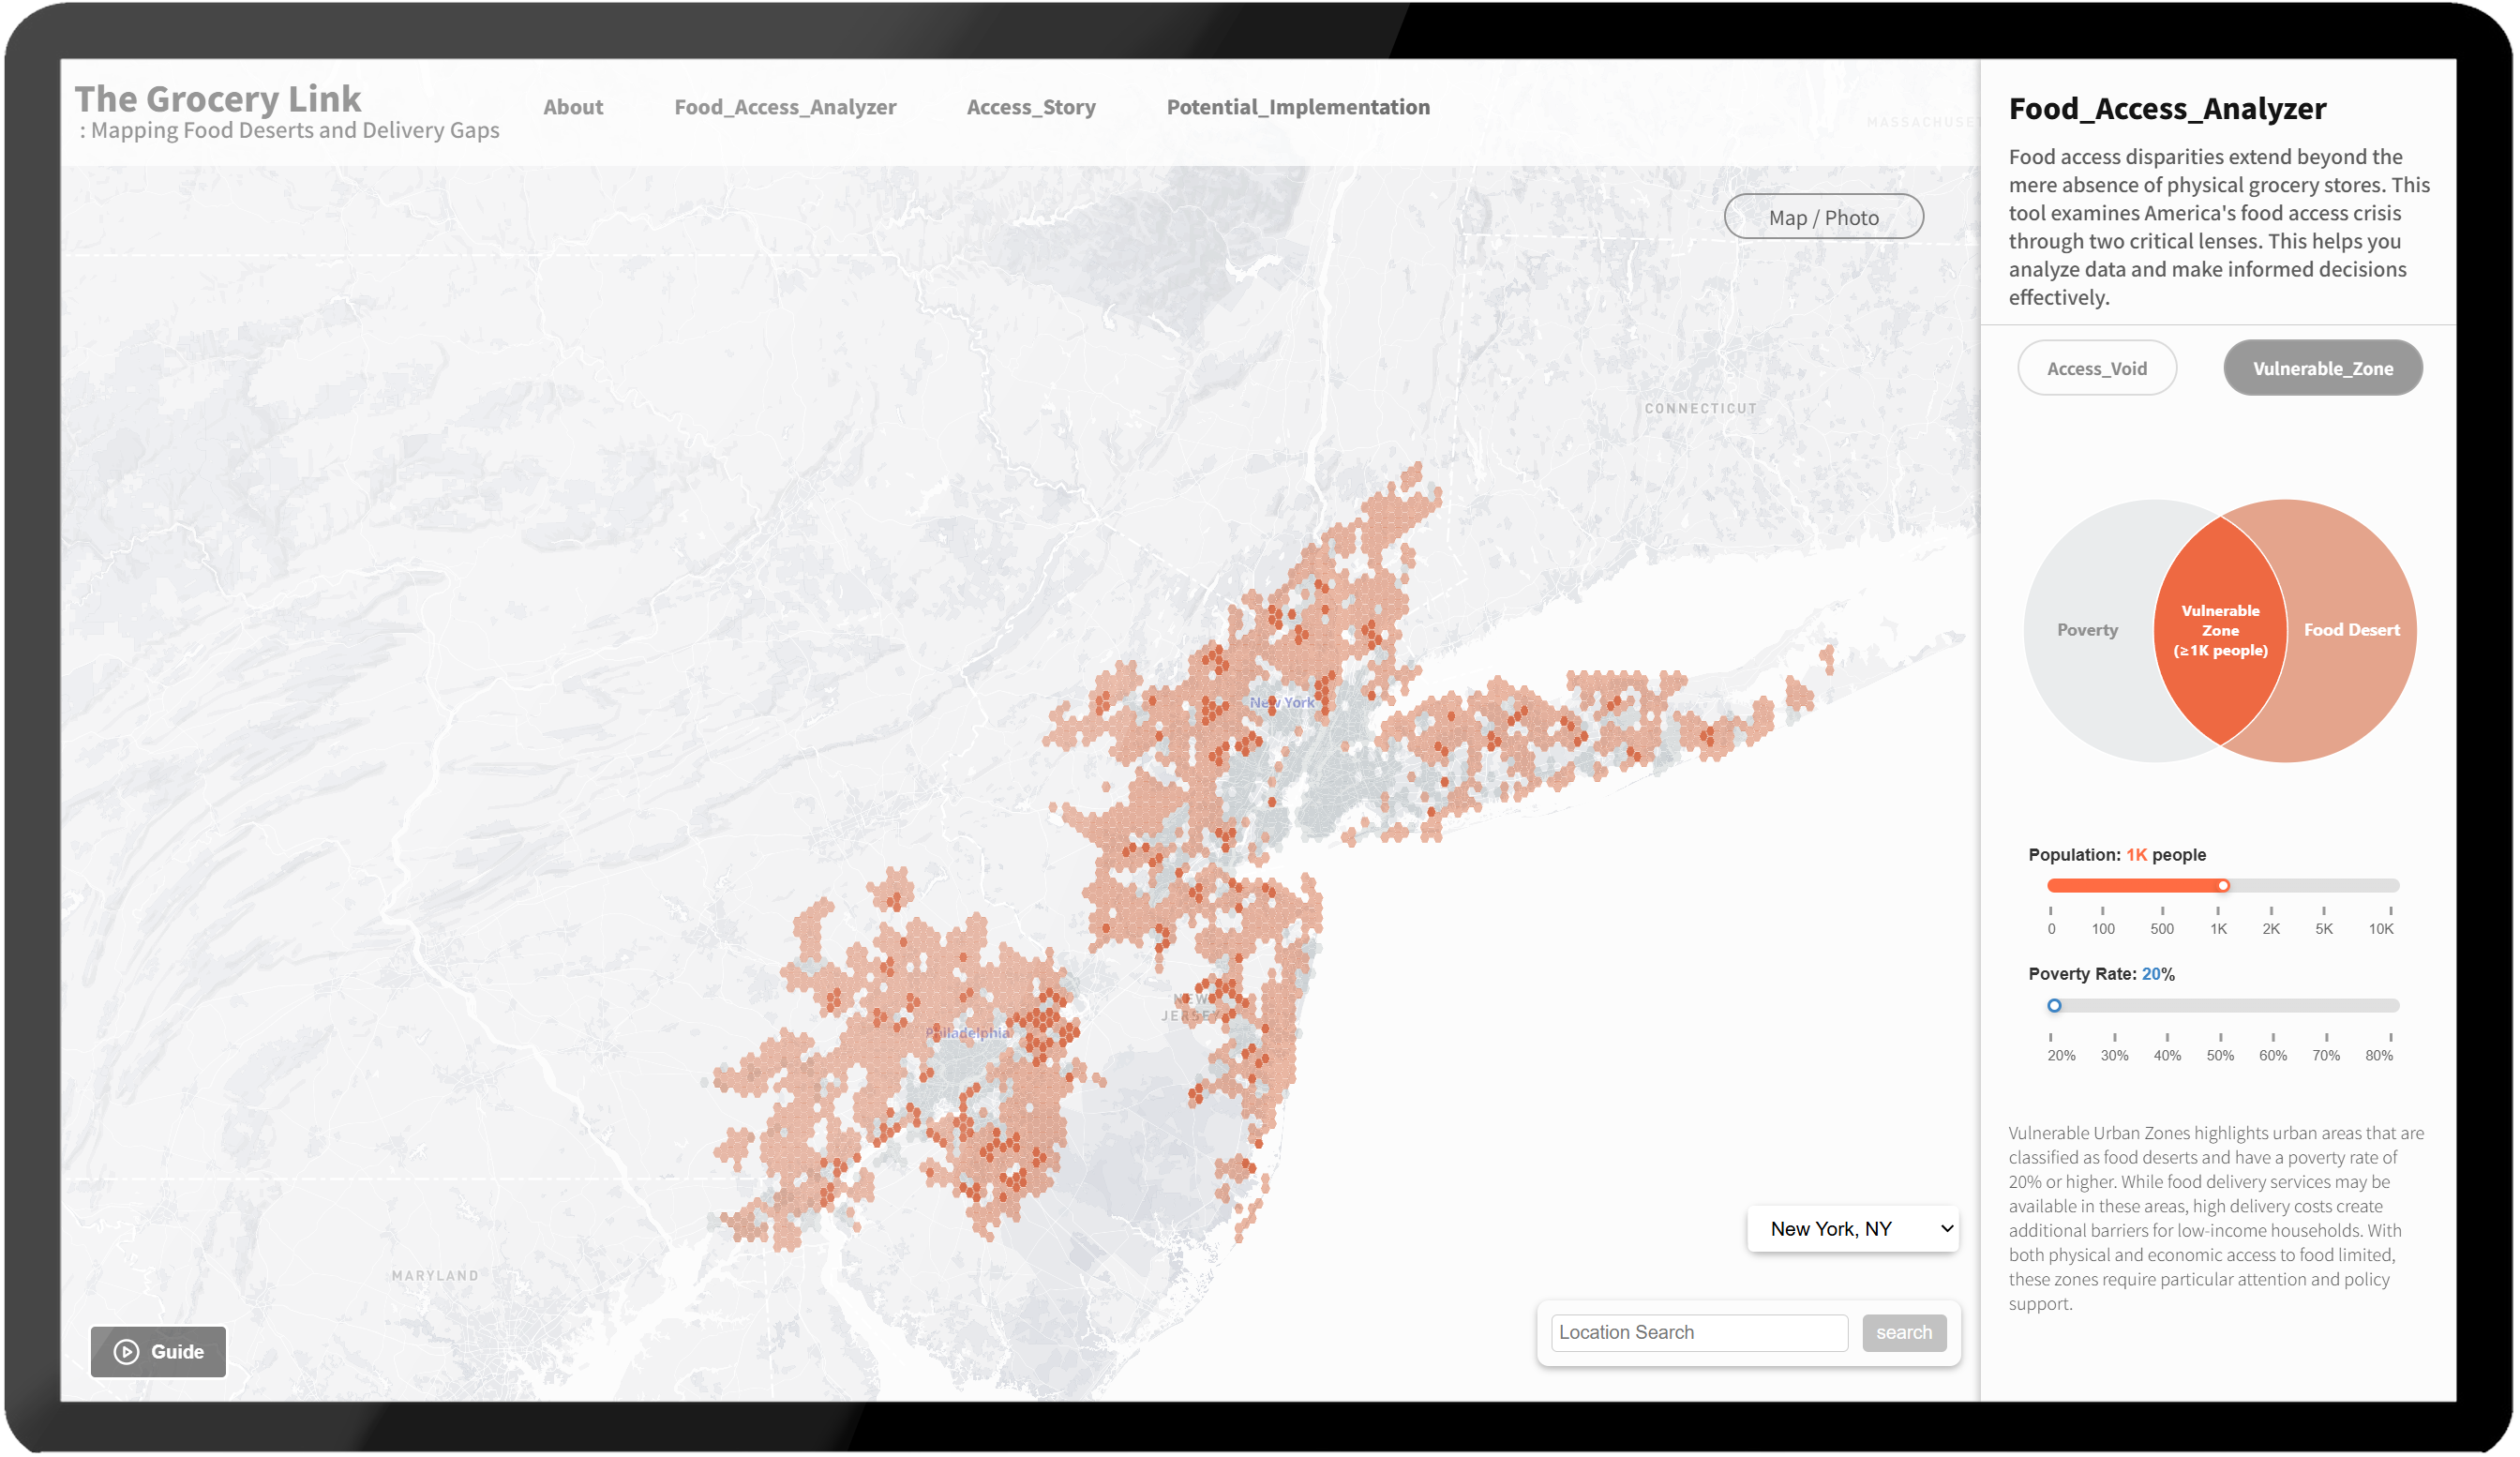
Second, "Vulnerable Zones" are areas where urban food deserts overlap with high poverty rates. While grocery delivery services are generally available in urban areas, delivery costs can be a significant economic burden for low-income households. These areas suffer from limitations in both physical and economic accessibility.
The tool I developed allows users to explore these priority food access areas. By considering both physical distance and delivery service availability, I hope this web-based tool will support decision-making for policymakers and community organizations.
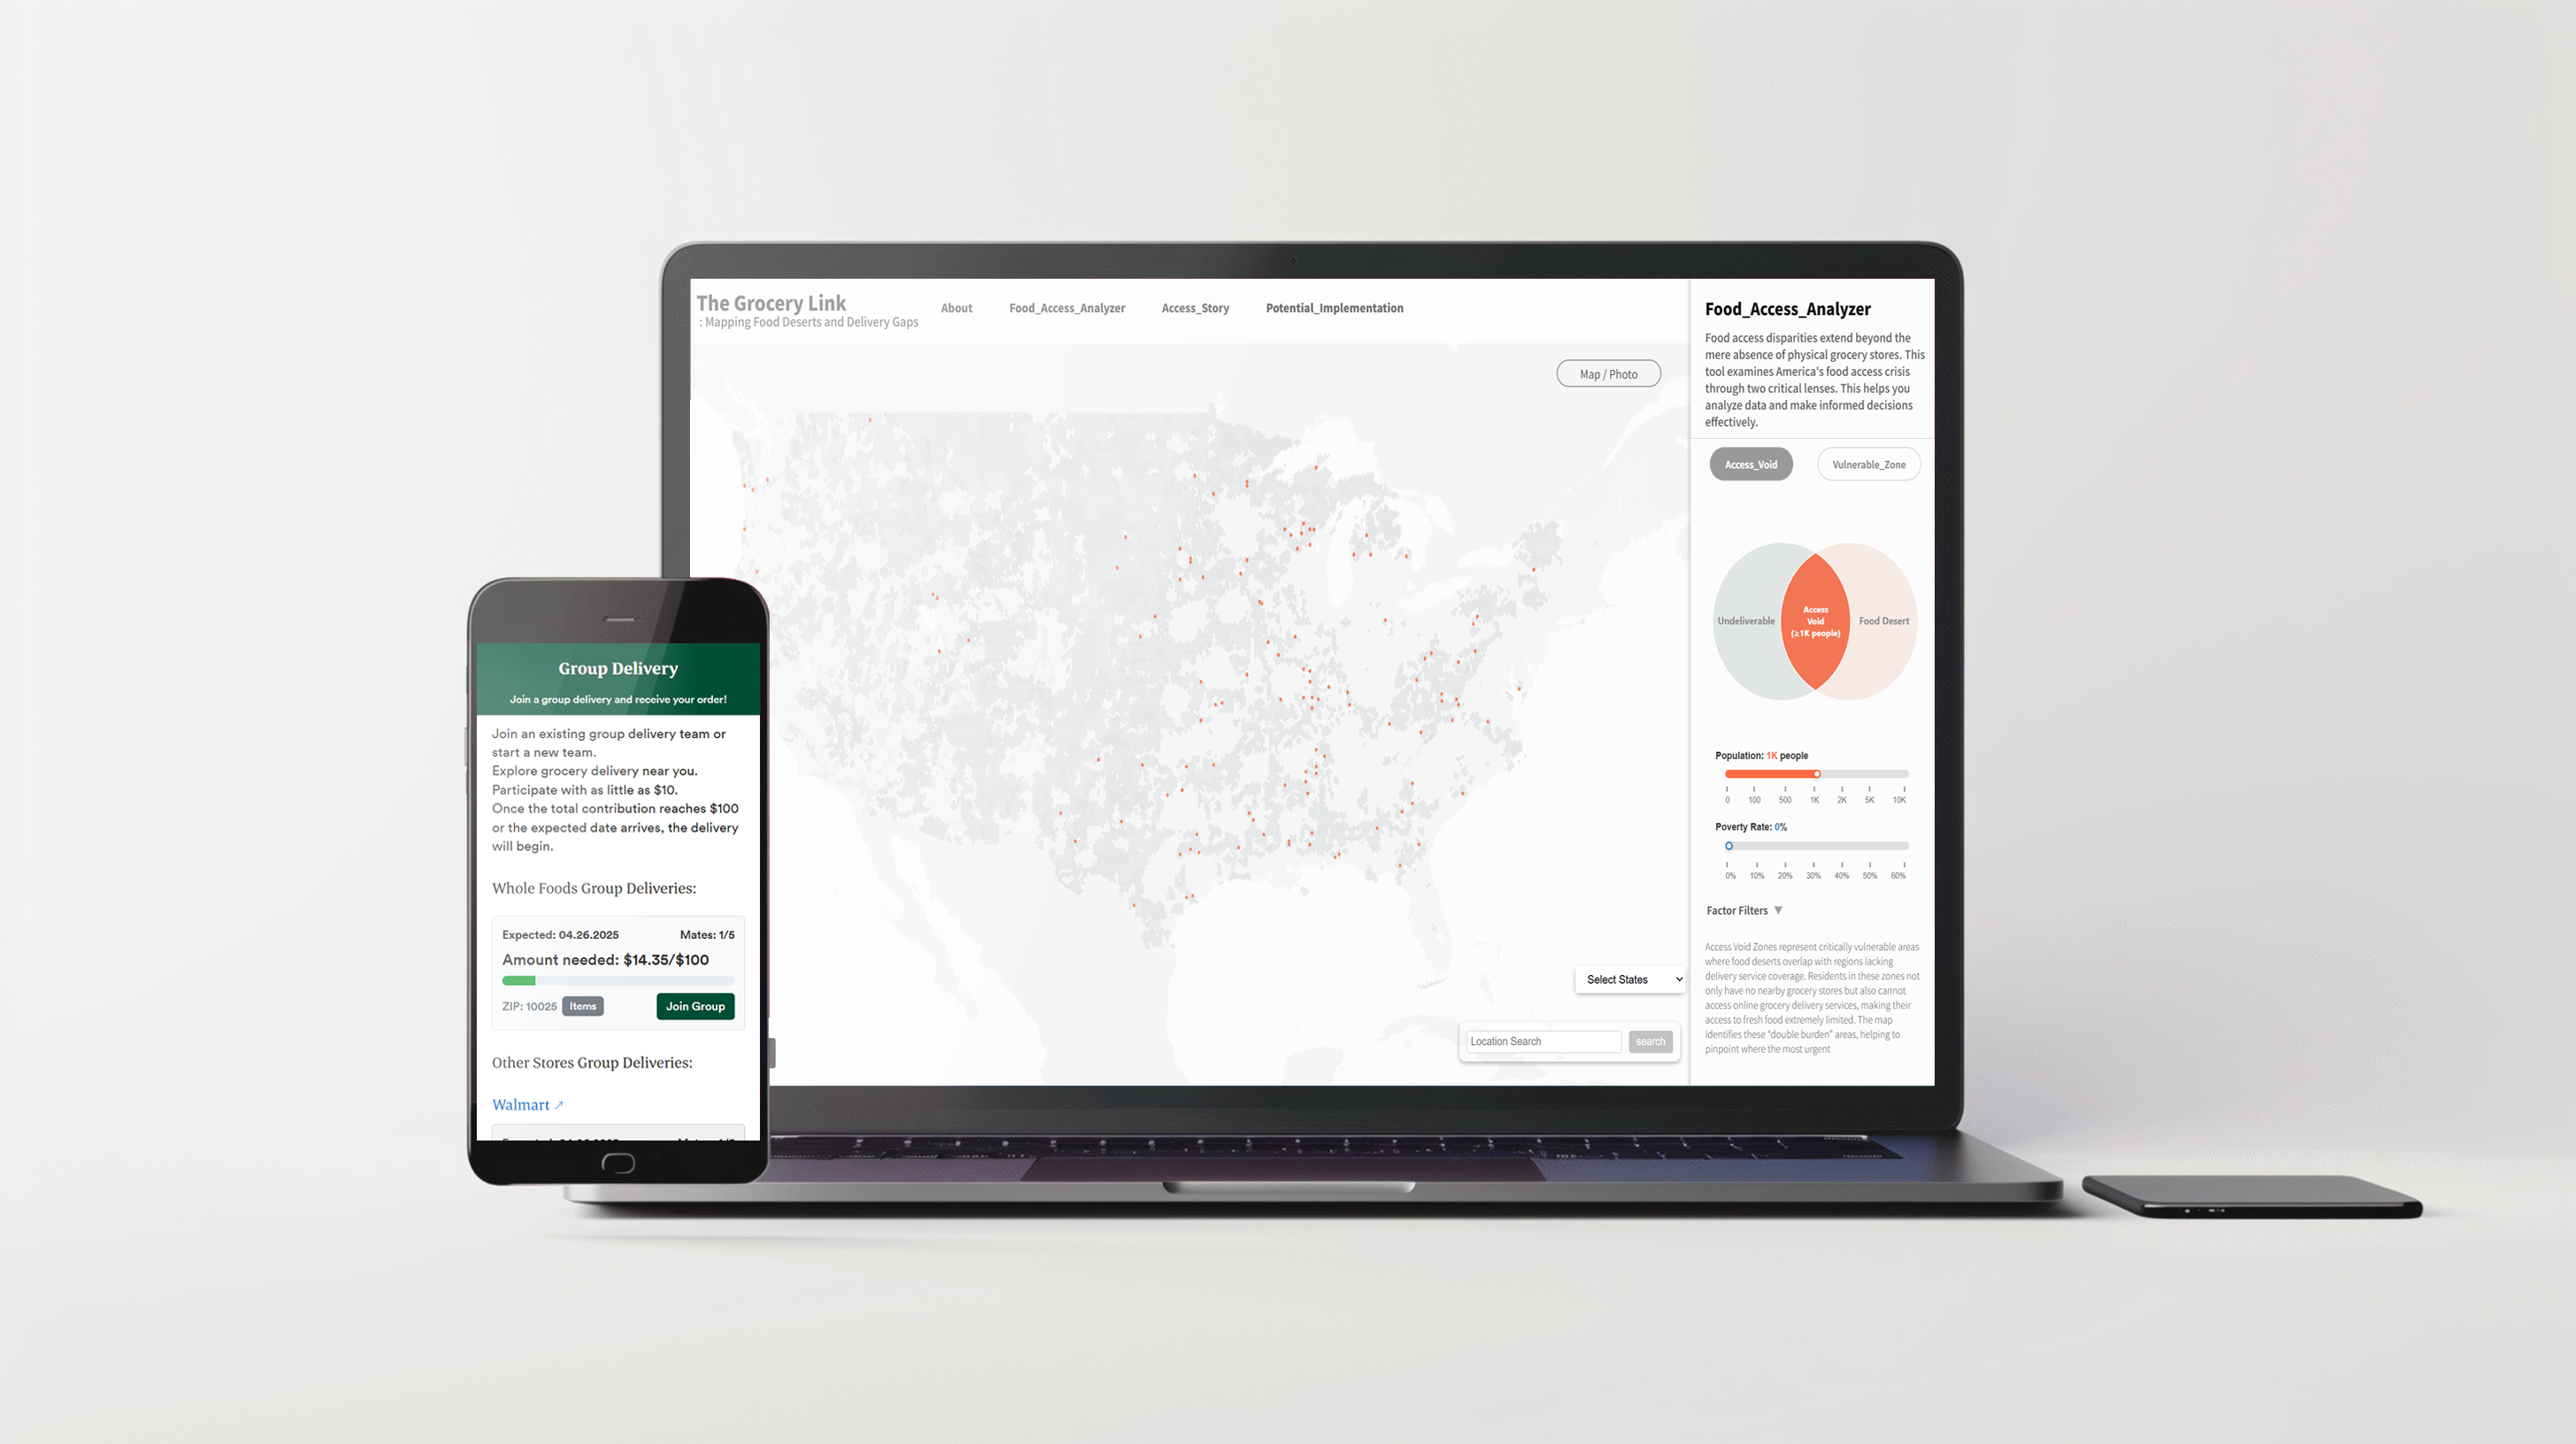
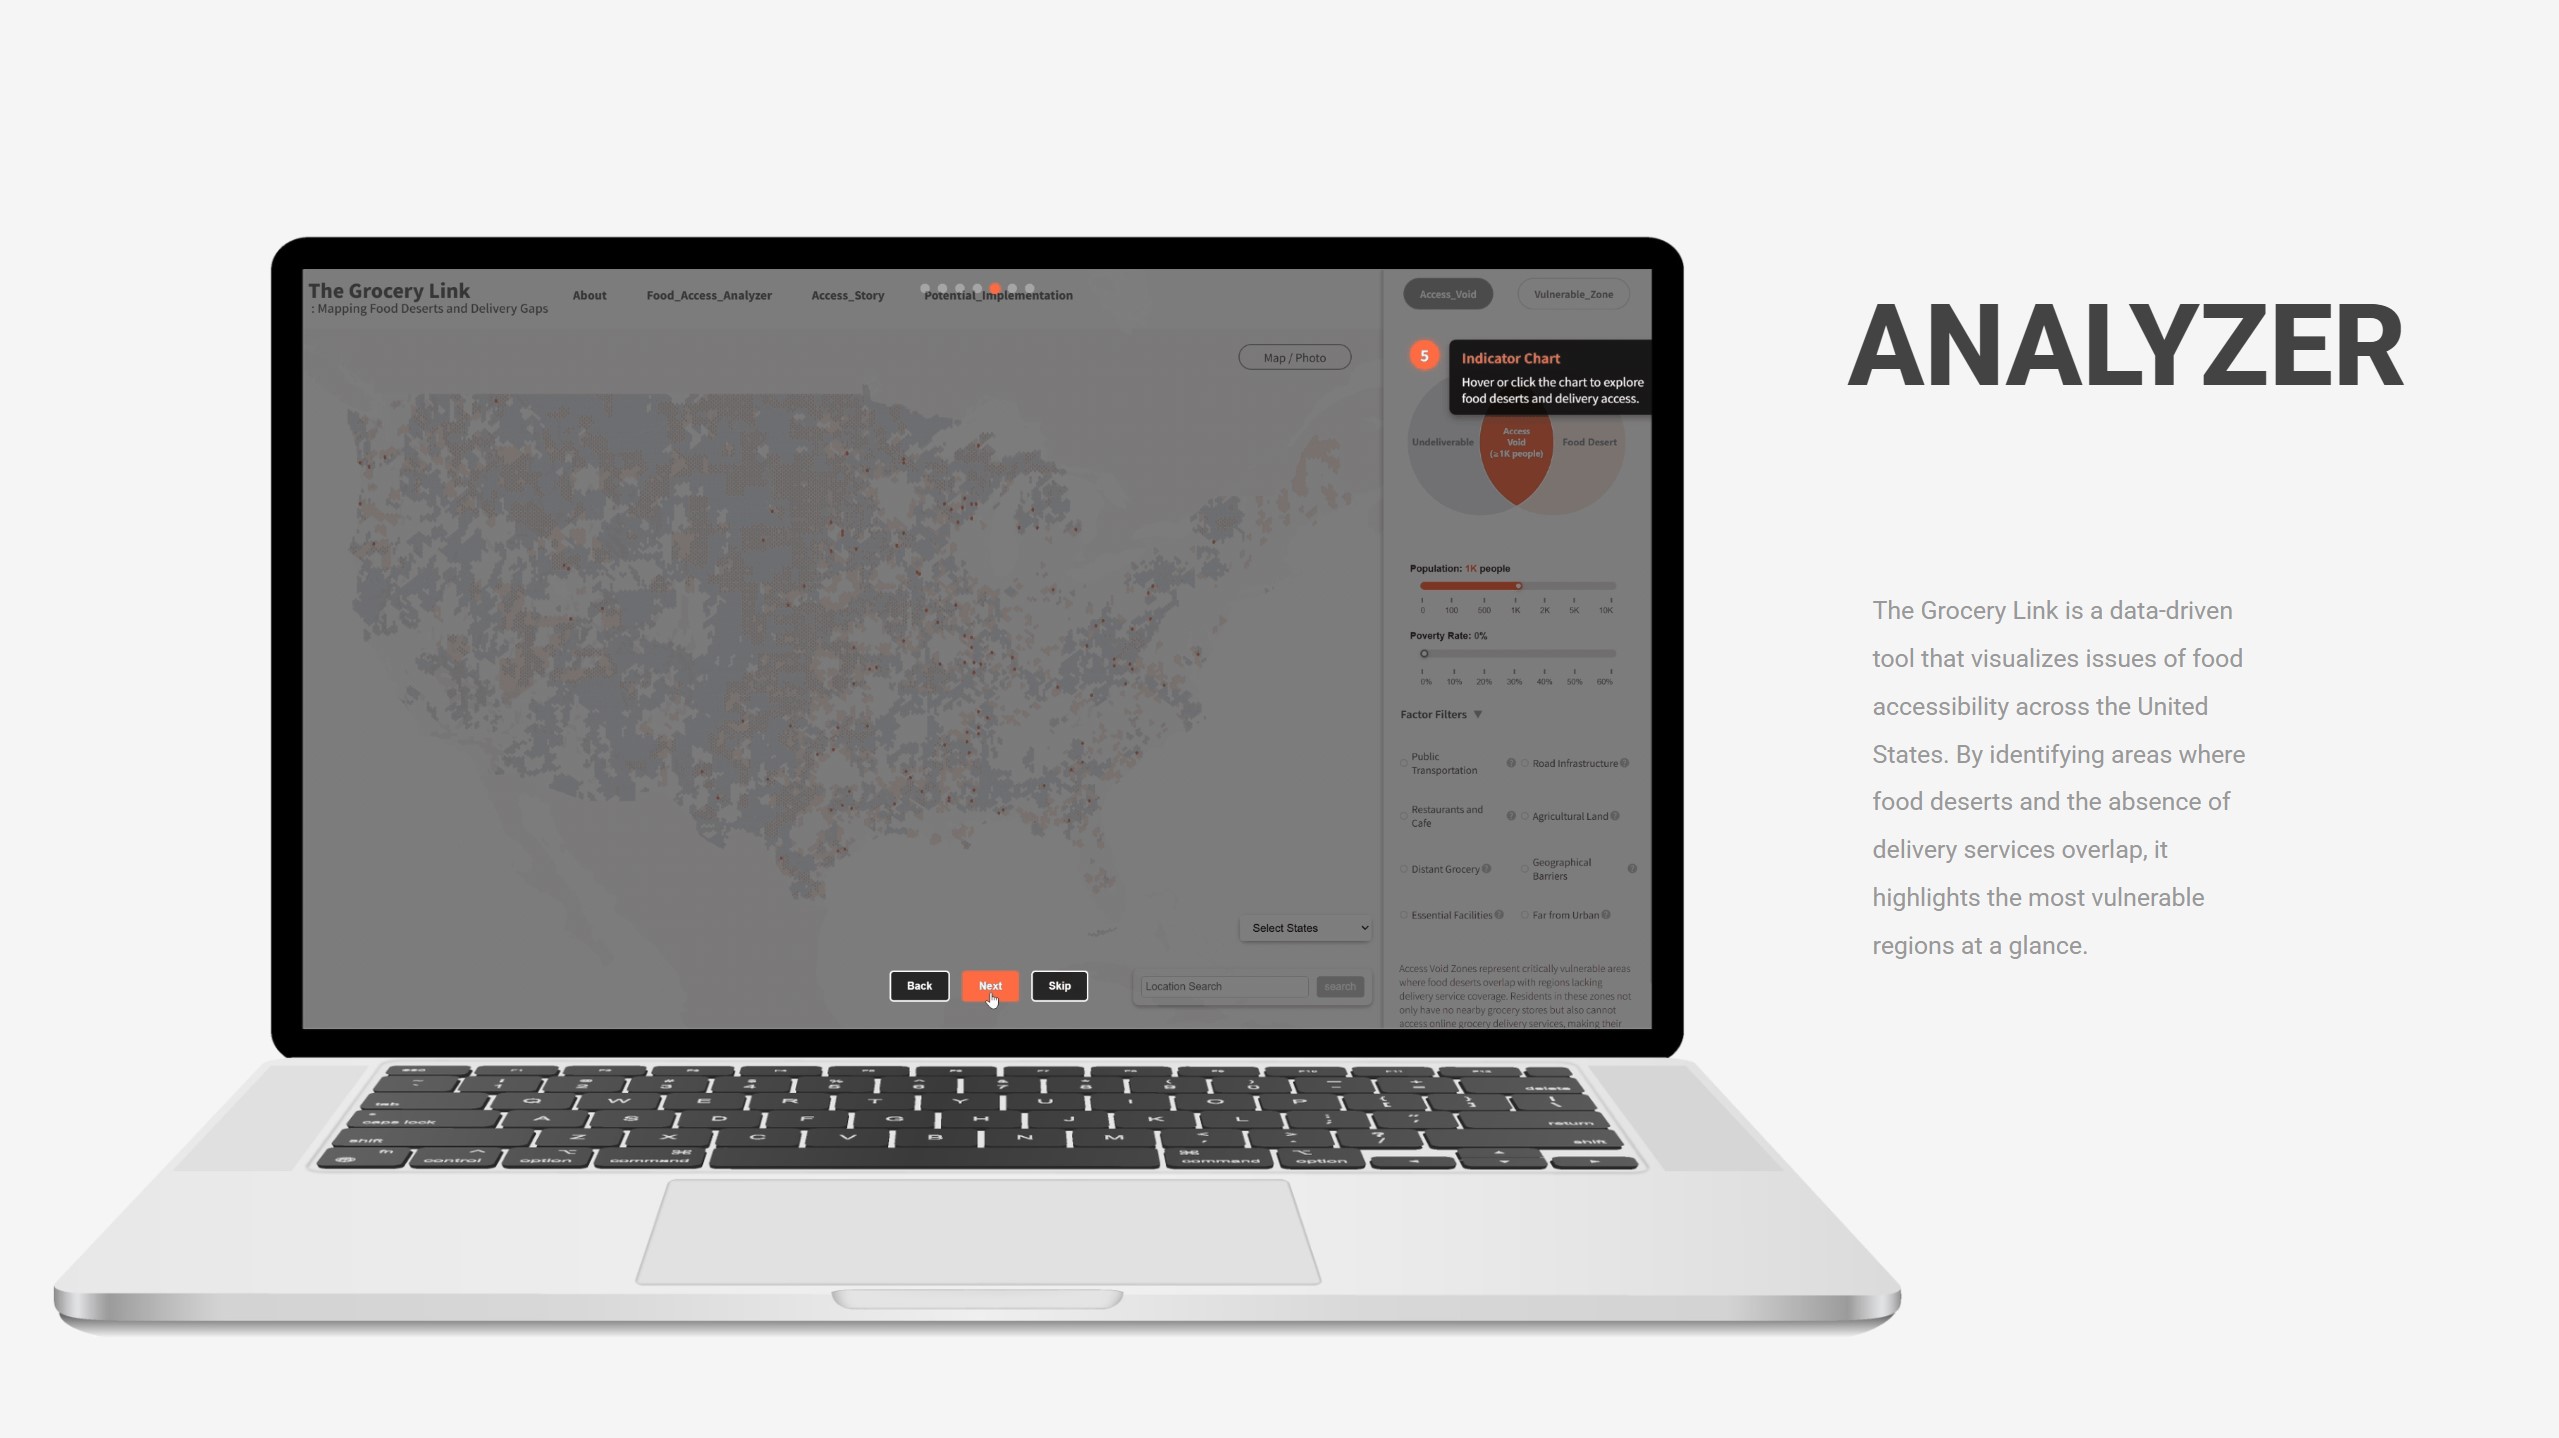
Food Access Mapping Tool: Data-Driven Decision Support
The Food Access Mapping Tool was developed as an interactive web-based platform to help policymakers, community organizations, and researchers visualize and analyze food access challenges. By integrating multiple datasets including USDA Food Access Research Atlas, U.S. Census Bureau data, and delivery service coverage information(Author collected), this tool provides comprehensive insights into America's food accessibility landscape.
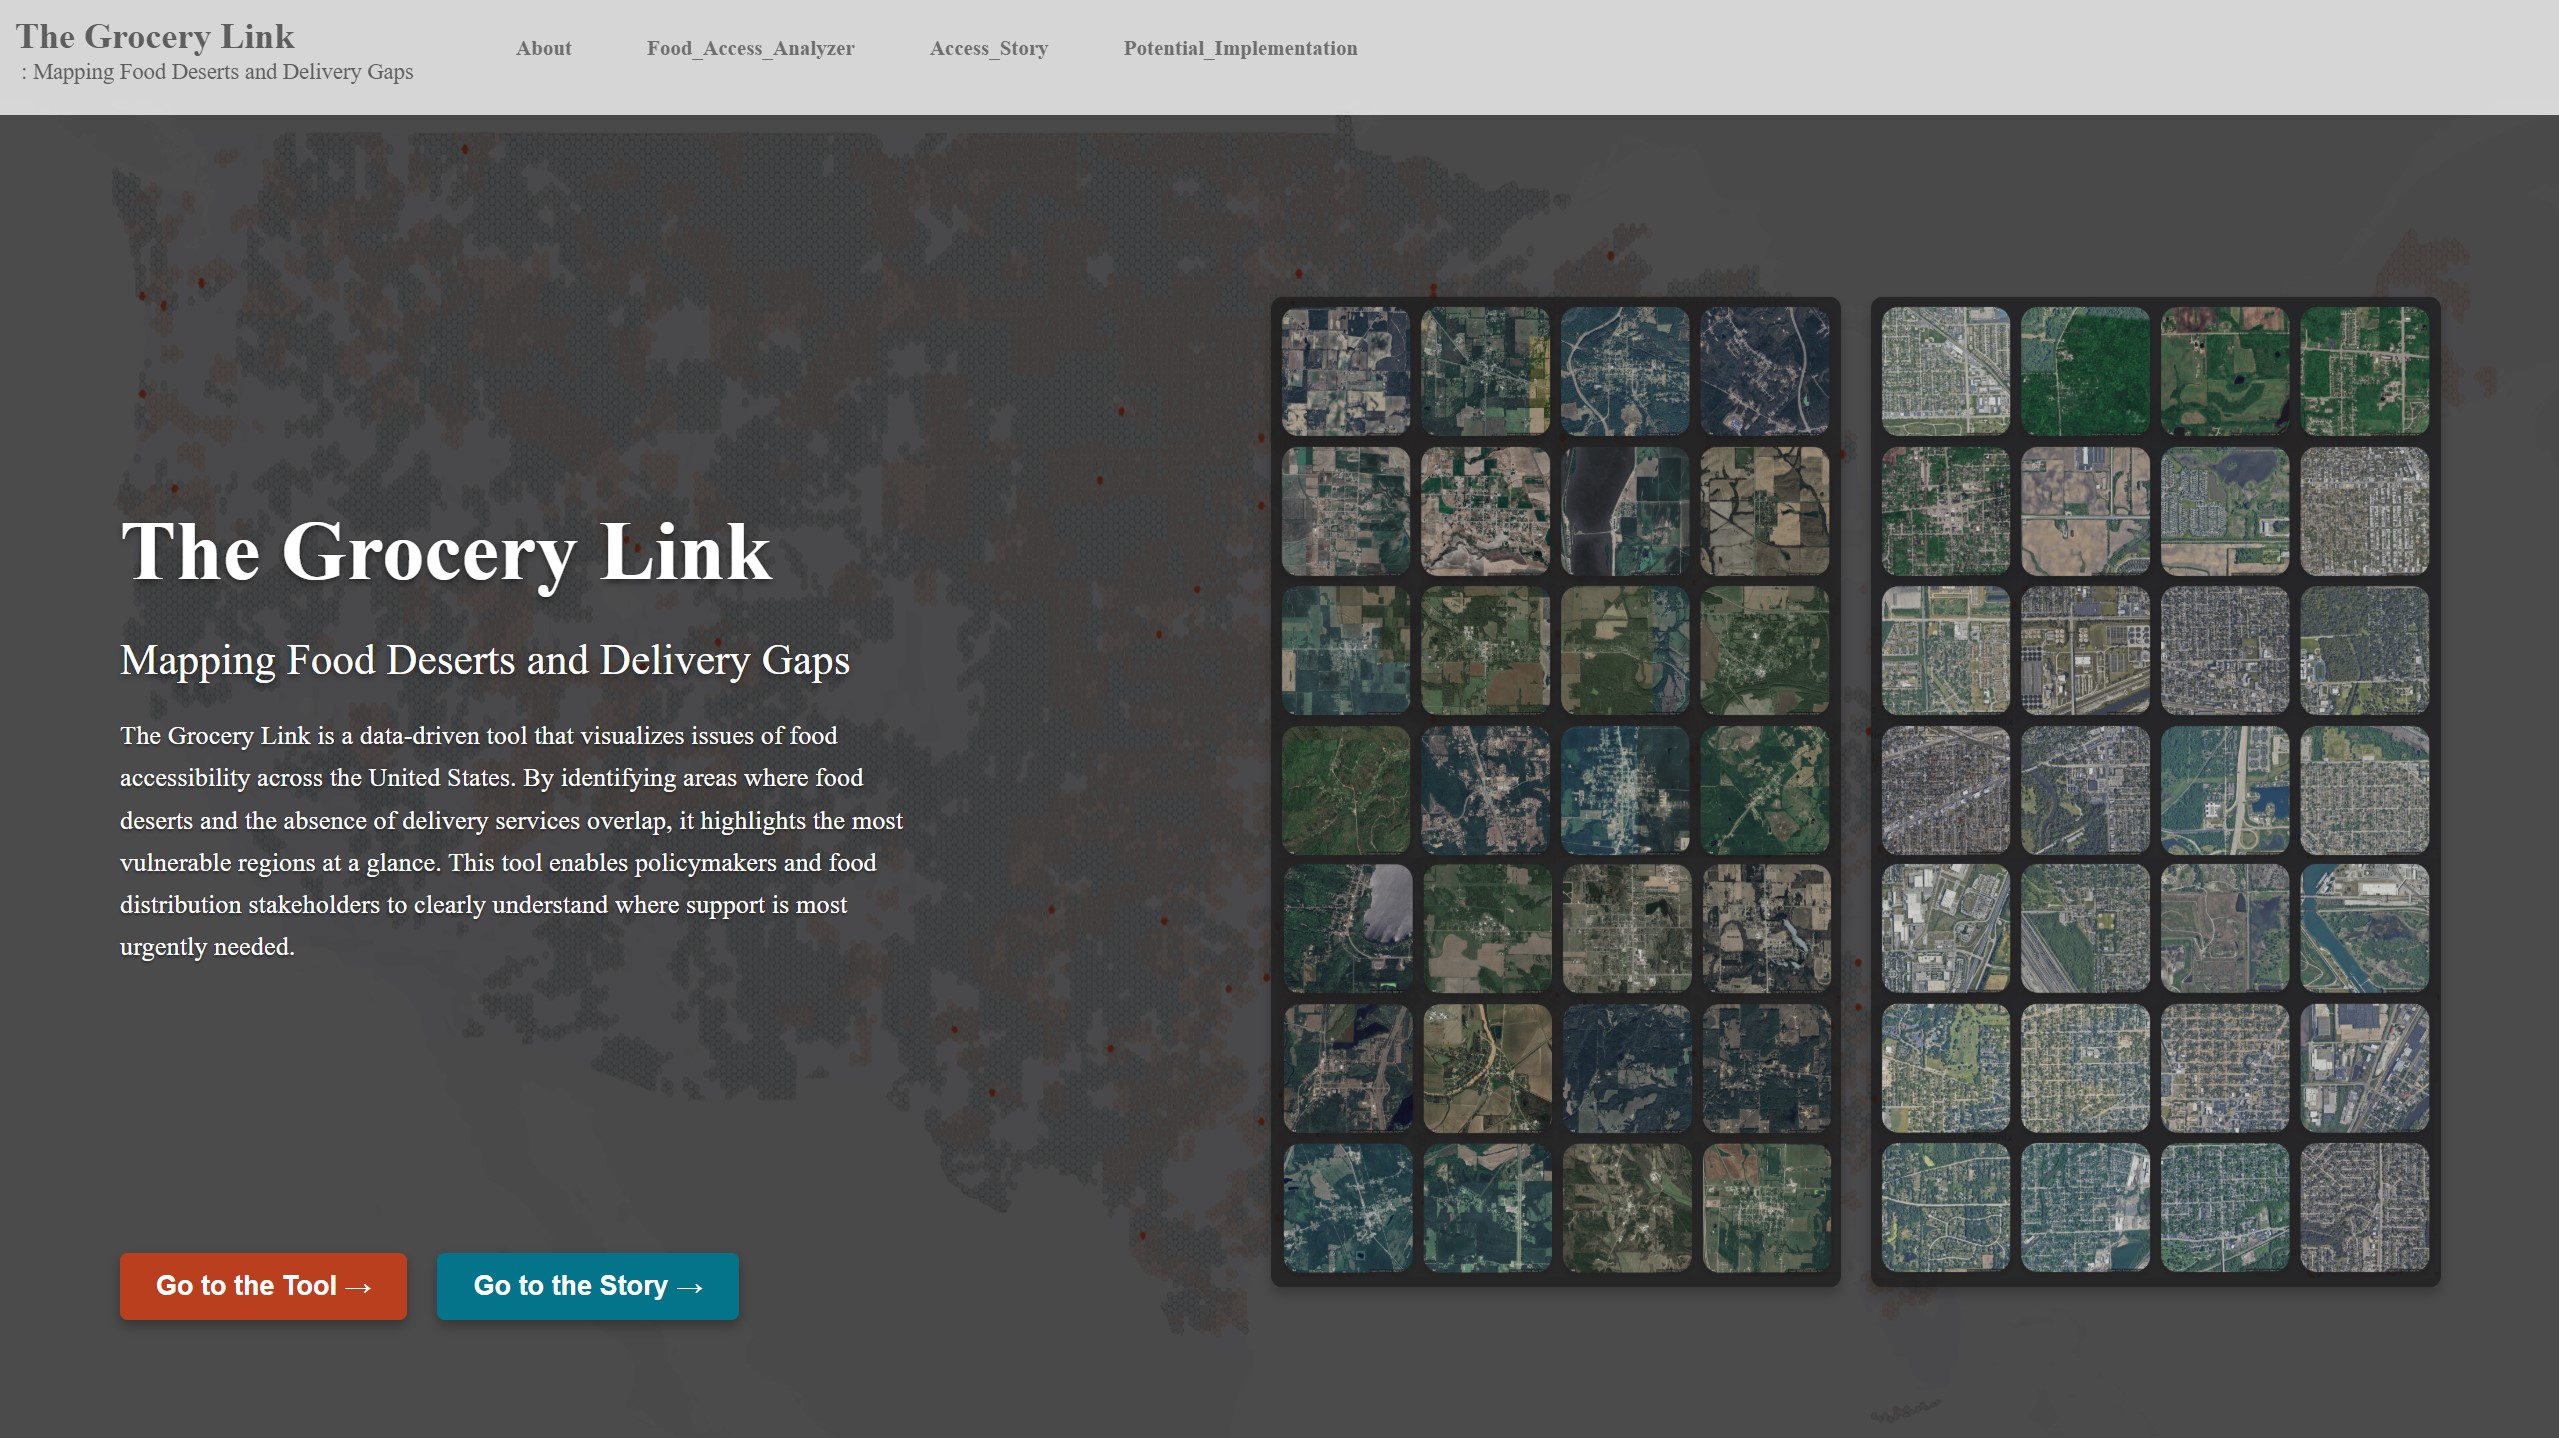
Tool Structure and Navigation
The Mapping Tool offers two main entry points for users:
- Food Access Story: Provides educational content about food access challenges for those unfamiliar with the concepts
- Food Access Analyzer: The interactive mapping platform for detailed data exploration
When accessing the website, users unfamiliar with food desert concepts can gain comprehensive background knowledge through the Story section, or they can proceed directly to the Analyzer for data exploration.
Interactive Features and Analysis Capabilities
The Food Access Analyzer includes numerous interactive elements designed for both broad overview and detailed investigation:
- Interactive Map Interface: Navigate across the United States to identify critical food access regions
- Visualization Controls: Toggle between different data layers including food deserts, delivery gaps, and their intersections
- Demographic Filters: Use population and poverty rate sliders to focus on areas matching specific criteria
- Factor Selection: Apply various socioeconomic filters to highlight communities with particular challenges
- Location-Specific Data: Hover over regions to view quick statistics; click for detailed community profiles
- Comparative Analysis: Switch between states or cities to understand regional variations and patterns
- Satellite View Integration: Examine the physical environment of affected areas through satellite imagery
From Data to Insights
The tool transforms raw data into meaningful insights that can guide intervention strategies. Users can:
- Identify the most severely affected Access Void communities across the country
- Analyze urban Vulnerable Zones where economic barriers compound physical access challenges
- Compare the effectiveness of potential solutions across different community types
- Generate reports with statistics and visualizations for policy development
- Prioritize intervention areas based on multiple factors including population, poverty, and accessibility metrics
By providing this comprehensive view, the Food Access Mapping Tool enables policymakers and community organizations to develop more targeted, effective approaches to addressing food accessibility challenges.
Current Policy for Food Accessibility & New Perspectives
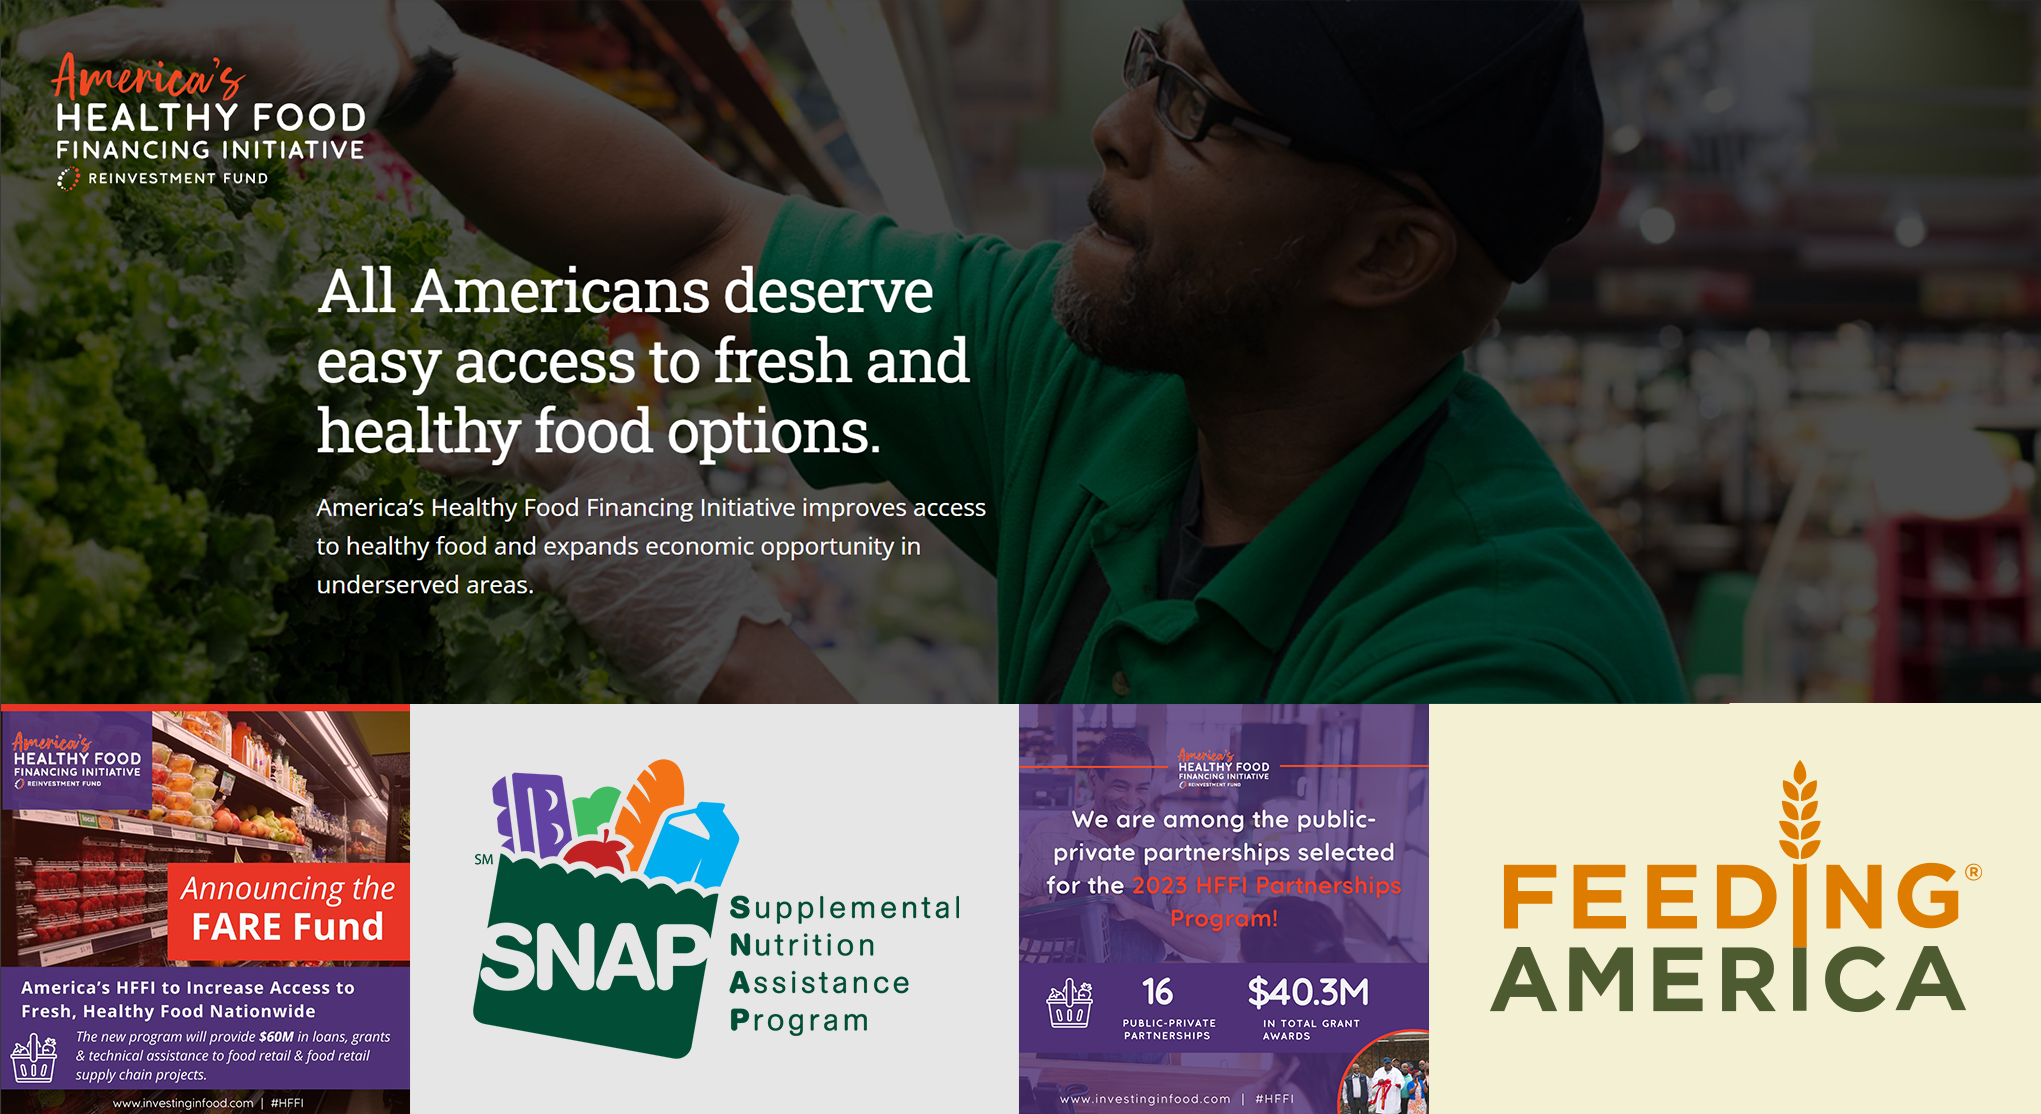
Most current policies addressing food desert issues focus primarily on physical infrastructure solutions. These typically involve:
- Subsidizing the construction of new grocery stores
- Expanding existing stores in underserved areas
- Establishing farmer partnerships for small direct-sale venues
The USDA's America's Healthy Food Financing Initiative exemplifies this approach, providing critical support for physical retail expansion in underserved communities.
While these physical infrastructure strategies are undoubtedly important, The Grocery Link emphasizes that delivery services deserve equal consideration alongside traditional solutions when tackling food accessibility issues. Traditional approaches require significant time and resources to implement, whereas delivery-based solutions offer potential for more rapid improvements in food access, particularly when supported by appropriate policies and community engagement.
Group Delivery: A Complementary Approach
To demonstrate practical applications of the research findings, The Grocery Link project includes a Group Delivery Chrome Extension—a prototype example that addresses the economic barriers preventing delivery service expansion.
The Economics of Delivery Gaps
Areas outside delivery zones are excluded primarily for economic reasons. While technical challenges like road infrastructure and maintaining food freshness exist, profitability remains the fundamental barrier. In densely populated urban areas, high order volumes distribute delivery costs efficiently across many customers. However, in less populated regions, delivery expenses become disproportionately high compared to sales revenue, making service extension economically unfeasible for retailers.
How Group Delivery Works
The Group Delivery concept offers a promising approach where multiple households combine orders for a single delivery. This system creates benefits for all stakeholders:
Consumers in underserved areas gain access to fresh food without traveling long distances Grocery stores improve delivery efficiency while expanding their customer base Existing delivery customers reduce costs through shared delivery fees Communities develop stronger social connections around food access.
The Chrome Extension Prototype
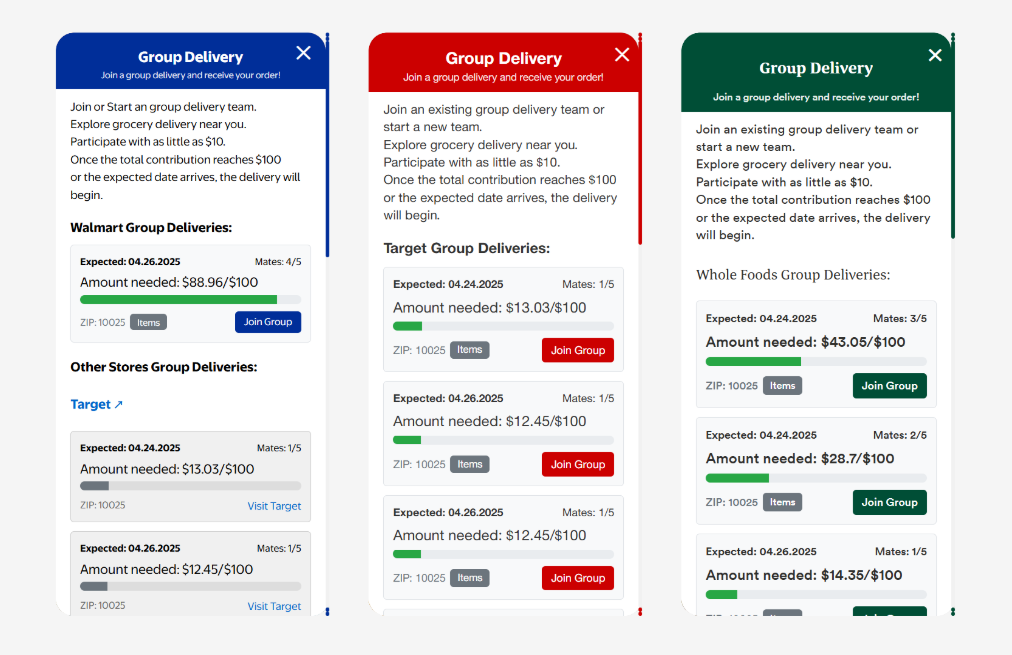
The Chrome extension developed for this project implements the group delivery concept in a practical, user-friendly format.
Group Delivery Interface
When installed and activated on a grocery store website, the extension:
- Automatically generates a group delivery button in the shopping interface
- Shows nearby delivery groups based on the user's location
- Displays product information from each group, fostering community awareness
- Allows users to join existing groups or create new ones with a minimum $10 purchase
- Provides market information and allows requesting additional markets
- Includes a community chat function for coordinating groups and sharing food information
The extension demonstrates how relatively simple technology solutions can facilitate community-based approaches to food access challenges, creating value for both consumers and retailers while addressing a significant public health issue.
Conclusion: Comprehensive Framework for Food Access
The Grocery Link project offers a new lens through which to view and address food access challenges in America. By considering both traditional food desert metrics and the emerging landscape of grocery delivery, the project provides a more nuanced understanding of where and how food access barriers manifest. The interactive mapping tool enables data-driven decision-making for policymakers and community organizations, while the group delivery prototype illustrates one of many potential innovations that could complement traditional infrastructure investments. Moving forward, this project could be enhanced through several key developments:
- Deeper Data Analysis: Refine analysis beyond USDA's food desert definitions to include more granular considerations for vulnerable populations such as people with disabilities and car-less households
- Community Engagement and Field Research: Conduct in-depth conversations with residents in identified priority areas to develop solutions tailored to specific regional needs and validate findings through targeted case studies
- Local Food System Integration: Explore connections with local food producers to address seasonality challenges and analyze environmental impacts including carbon footprint reduction opportunities
- Enhanced User Experience and Accessibility: Design systems considering the technological constraints in food desert communities, potentially involving intermediaries like churches or community centers, and optimizing for time-constrained users
- Evolution from Analysis to Design Tool: Expand functionality to simulate optimal grocery store placement that could reduce food deserts by specific percentages and identify critical food supply points requiring support
- Policy Implementation Pathways: Connect findings with existing political initiatives, such as New York City mayoral candidates' grocery store policies, and include economic feasibility analyses to support actionable policy recommendations
Through this expanded and refined approach, The Grocery Link can evolve from an analytical framework to a comprehensive design and policy tool, working toward ensuring that all Americans, regardless of location or economic status, have reliable access to fresh, nutritious food—a fundamental requirement for public health and wellbeing.
For more information or to explore the interactive Food Access Mapping Tool,
visit project website.
Key Data Sources
- USDA Food Access Research Atlas: Used for defining and mapping food desert areas
- U.S. Census Bureau Data: Provides demographic information, poverty rates, income levels, and other socioeconomic indicators
- Service Area Data from Major Grocery Delivery Providers: Used to analyze online delivery service availability
- Transportation and Infrastructure Data: Leverages data from the U.S. Department of Transportation and local transit agencies to assess transportation accessibility
Analytical Methodology
- Geographic Information System (GIS) Analysis: Identifies and visualizes overlaps between food desert areas and delivery service gaps
- Demographic Analysis: Explores socioeconomic dimensions of food access issues
- Accessibility Gap Assessment: Multi-criteria analysis for identifying Access_Voids and Vulnerable_Zones
- Policy Simulation: Modeling potential impacts of various intervention scenarios on food accessibility
References
- Food Access Research Atlas, USDA. https://pmc.ncbi.nlm.nih.gov/articles/PMC8990744/Trude.
- ACB, Lowery CM, Ali SH, Vedovato GM. An equity-oriented systematic review of online grocery shopping among low-income populations:
implications for policy and research. Nutr Rev. 2022 Apr 8;80(5):1294-1310. doi: 10.1093/nutrit/nuab122. PMID: 35076065; PMCID: PMC8990744. https://pmc.ncbi.nlm.nih.gov/articles/PMC8990744/Trude.
- Delivering to deserts: New data reveals the geography of digital access to food in the U.S. https://www.brookings.edu/articles/delivering-to-deserts-new-data-reveals-the-geography-of-digital-access-to-food-in-the-us/.
- Officer Involved, Josh Begley. https://theintercept.co/officer-involved/.
- Climate—Conflict—Vulnerability Index. https://climate-conflict.org/www/data-pages/hazards.