Where the Water Reached
Yilin Zheng
Flood hazards are one of most frequent and expensive natural hazards in America. This trend of increasing risk is pushing policy makers, real estates, and insurance markets to update their system in order to close loss that is increasing every year.
But what should the individuals do?
My interest in this issue began with the repetitive floods I witnessed while living in Louisiana. Within five years, I experienced two major events (in 2016 and 2021) where water rose over five feet in my community. These floods caused millions in infrastructure damage, displacing families and burdening those without flood insurance.
Just last year (2024), there were twelve billion-dollar flood-related disasters in the U.S.—a number that continues to rise.
Unlike homeowners insurance, which is mandated by mortgage lenders, flood insurance remains optional—especially for homes outside high-risk FEMA zones. Yet over 20% of all NFIP claims come from those very areas.
Most homeowners policies exclude rising water and flooding, even those triggered by hurricanes. Without a separate flood policy, the financial burden falls on individuals, often unexpectedly.
This raises a critical question: Why aren’t users presented with this risk clearly when making housing decisions?
_Behavioral Economics and the Limits of Rationality_
Many buyers prioritize upfront costs, filter listings for convenience, and assume insurance will catch what the platform doesn’t.
The homebuying process is fragmented—steps from search to closing are messy, and risk is rarely surfaced in ways that connect with one's lived concerns.
The focus turns to how behavioral biases shape housing decisions. Buyers and renters alike bring urgent needs and deeply personal constraints into the process—but their perspectives diverge sharply.
User mapping revealed a distinct split between homeowners and renters. These groups differ not only in legal responsibility, but also in age, exposure to advertising, and how they perceive the “value” of a property. Renters are often younger, more transient, and less likely to be targeted by messaging about long-term risks. Homeowners, on the other hand, face greater financial stakes and are more exposed to content around insurance, resilience, and resale value.
This divergence shaped a key decision: the platform cannot—and should not—speak to everyone. Instead, it narrows its focus to those actively making long-term commitments: prospective homeowners weighing risk against affordability, especially in high-exposure areas.
System Mapping and Research Process
Throughout the exploration phase, I investigated the overlapping systems of policy, property, and perception. I mapped relationships between FEMA zones, historical claims, insurance gaps, and household income.
This digital archive is an ongoing record of that process—combining personal experience, research, and community engagement.
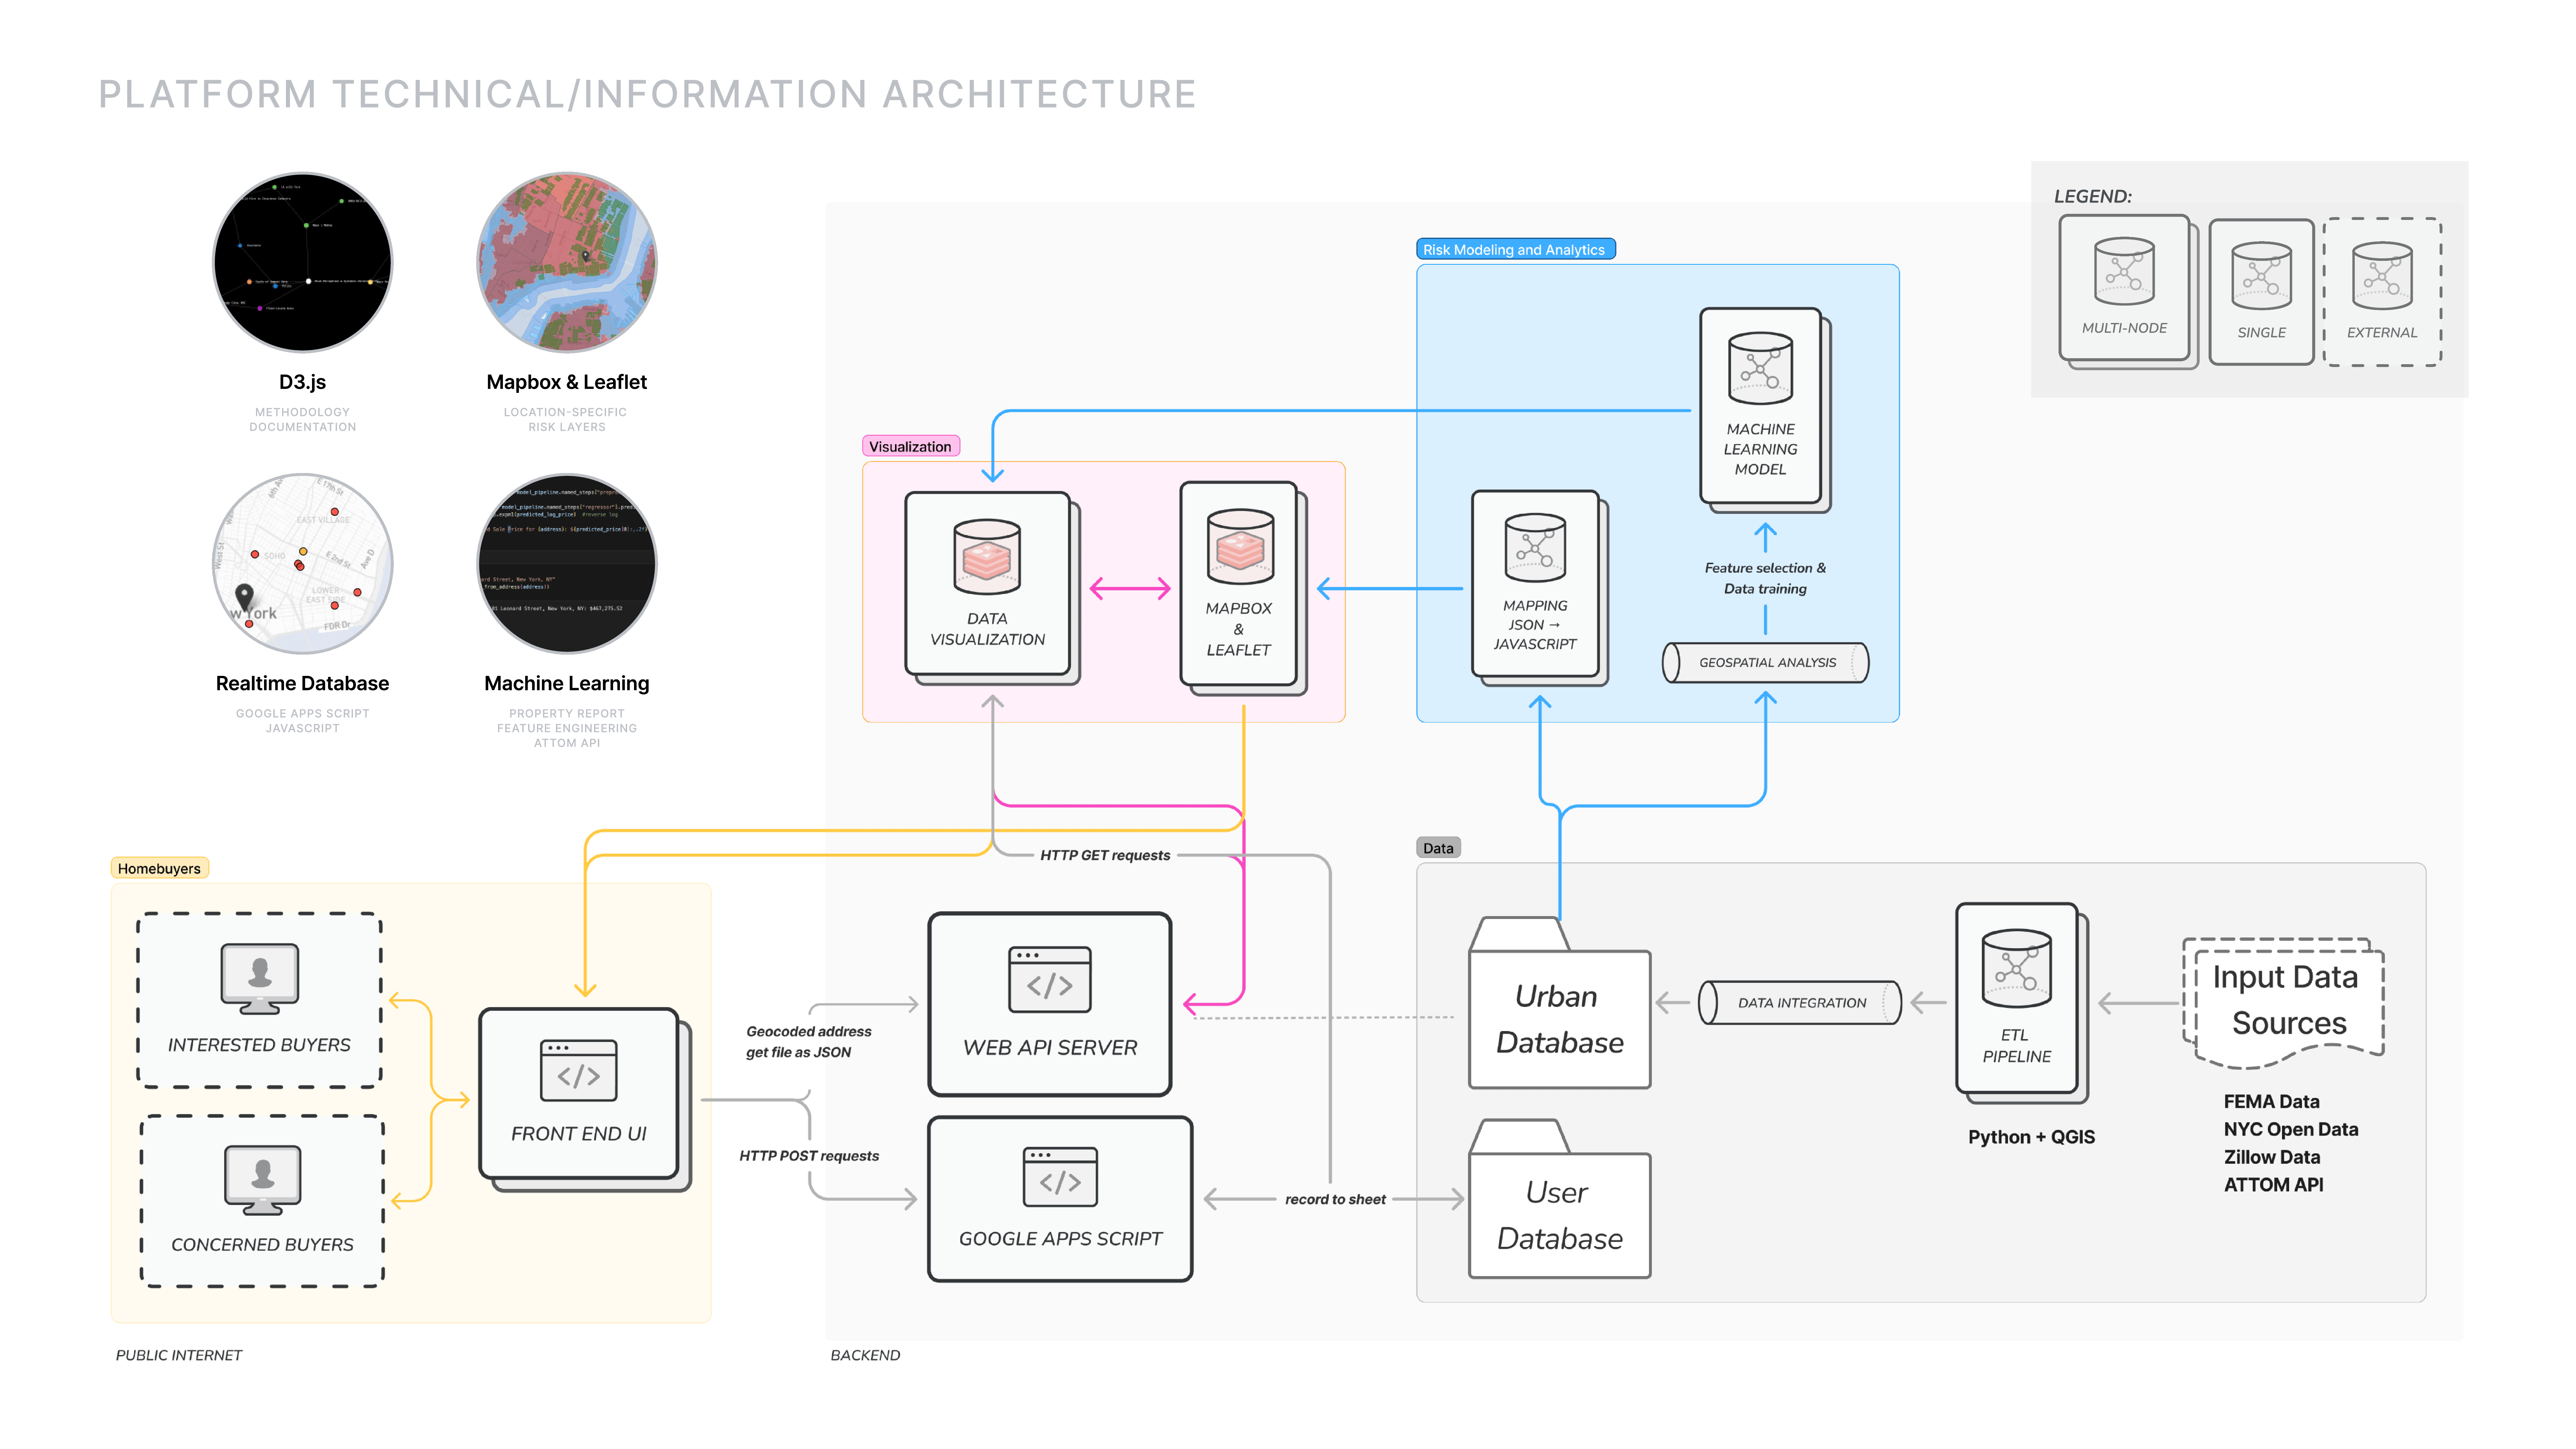
The Tool
I want to approach risk not as abstract data, but as a cost as a way to make vulnerability tangible for those navigating decisions with limited resources.
This isn’t about predicting market trends or prices. It’s about contextualizing what risk means for people making deeply personal investments in uncertain futures.
The tool prototype guides the homeowners and home buyers through a simple flow:
- Landing Page — A brief overview and entry point.
- Perception Q&A — To understand the user’s priorities and awareness.
- Property Report — Presents localized insights and cost breakdowns.
- Explore Spatial Data — Interactive maps and overlays connect individual choices with broader patterns of flood risk.
⸻
_Weak Correlation_
One important insight from the study: disaster events like floods have limited influence on long-term sale prices.
Statistical analysis shows:
• A p-value of 0.32 in sale price comparisons across different flood zones.
• A very small sum of squares attributable to flood zone status, meaning flood zone alone explains little of the price variation.
This suggests market signals are not aligned with environmental vulnerability—another signal of how invisible risk remains at the point of decision.
Individual Risk to Collective Imagination
This project is not just a critique—it’s a call to action.
It invites homebuyers to recognize risk, contribute their stories, and rethink how housing markets can reflect lived vulnerability. It asks whether shared awareness could ripple outward, reshaping how we price, plan, and protect communities in the face of accelerating climate hazards.
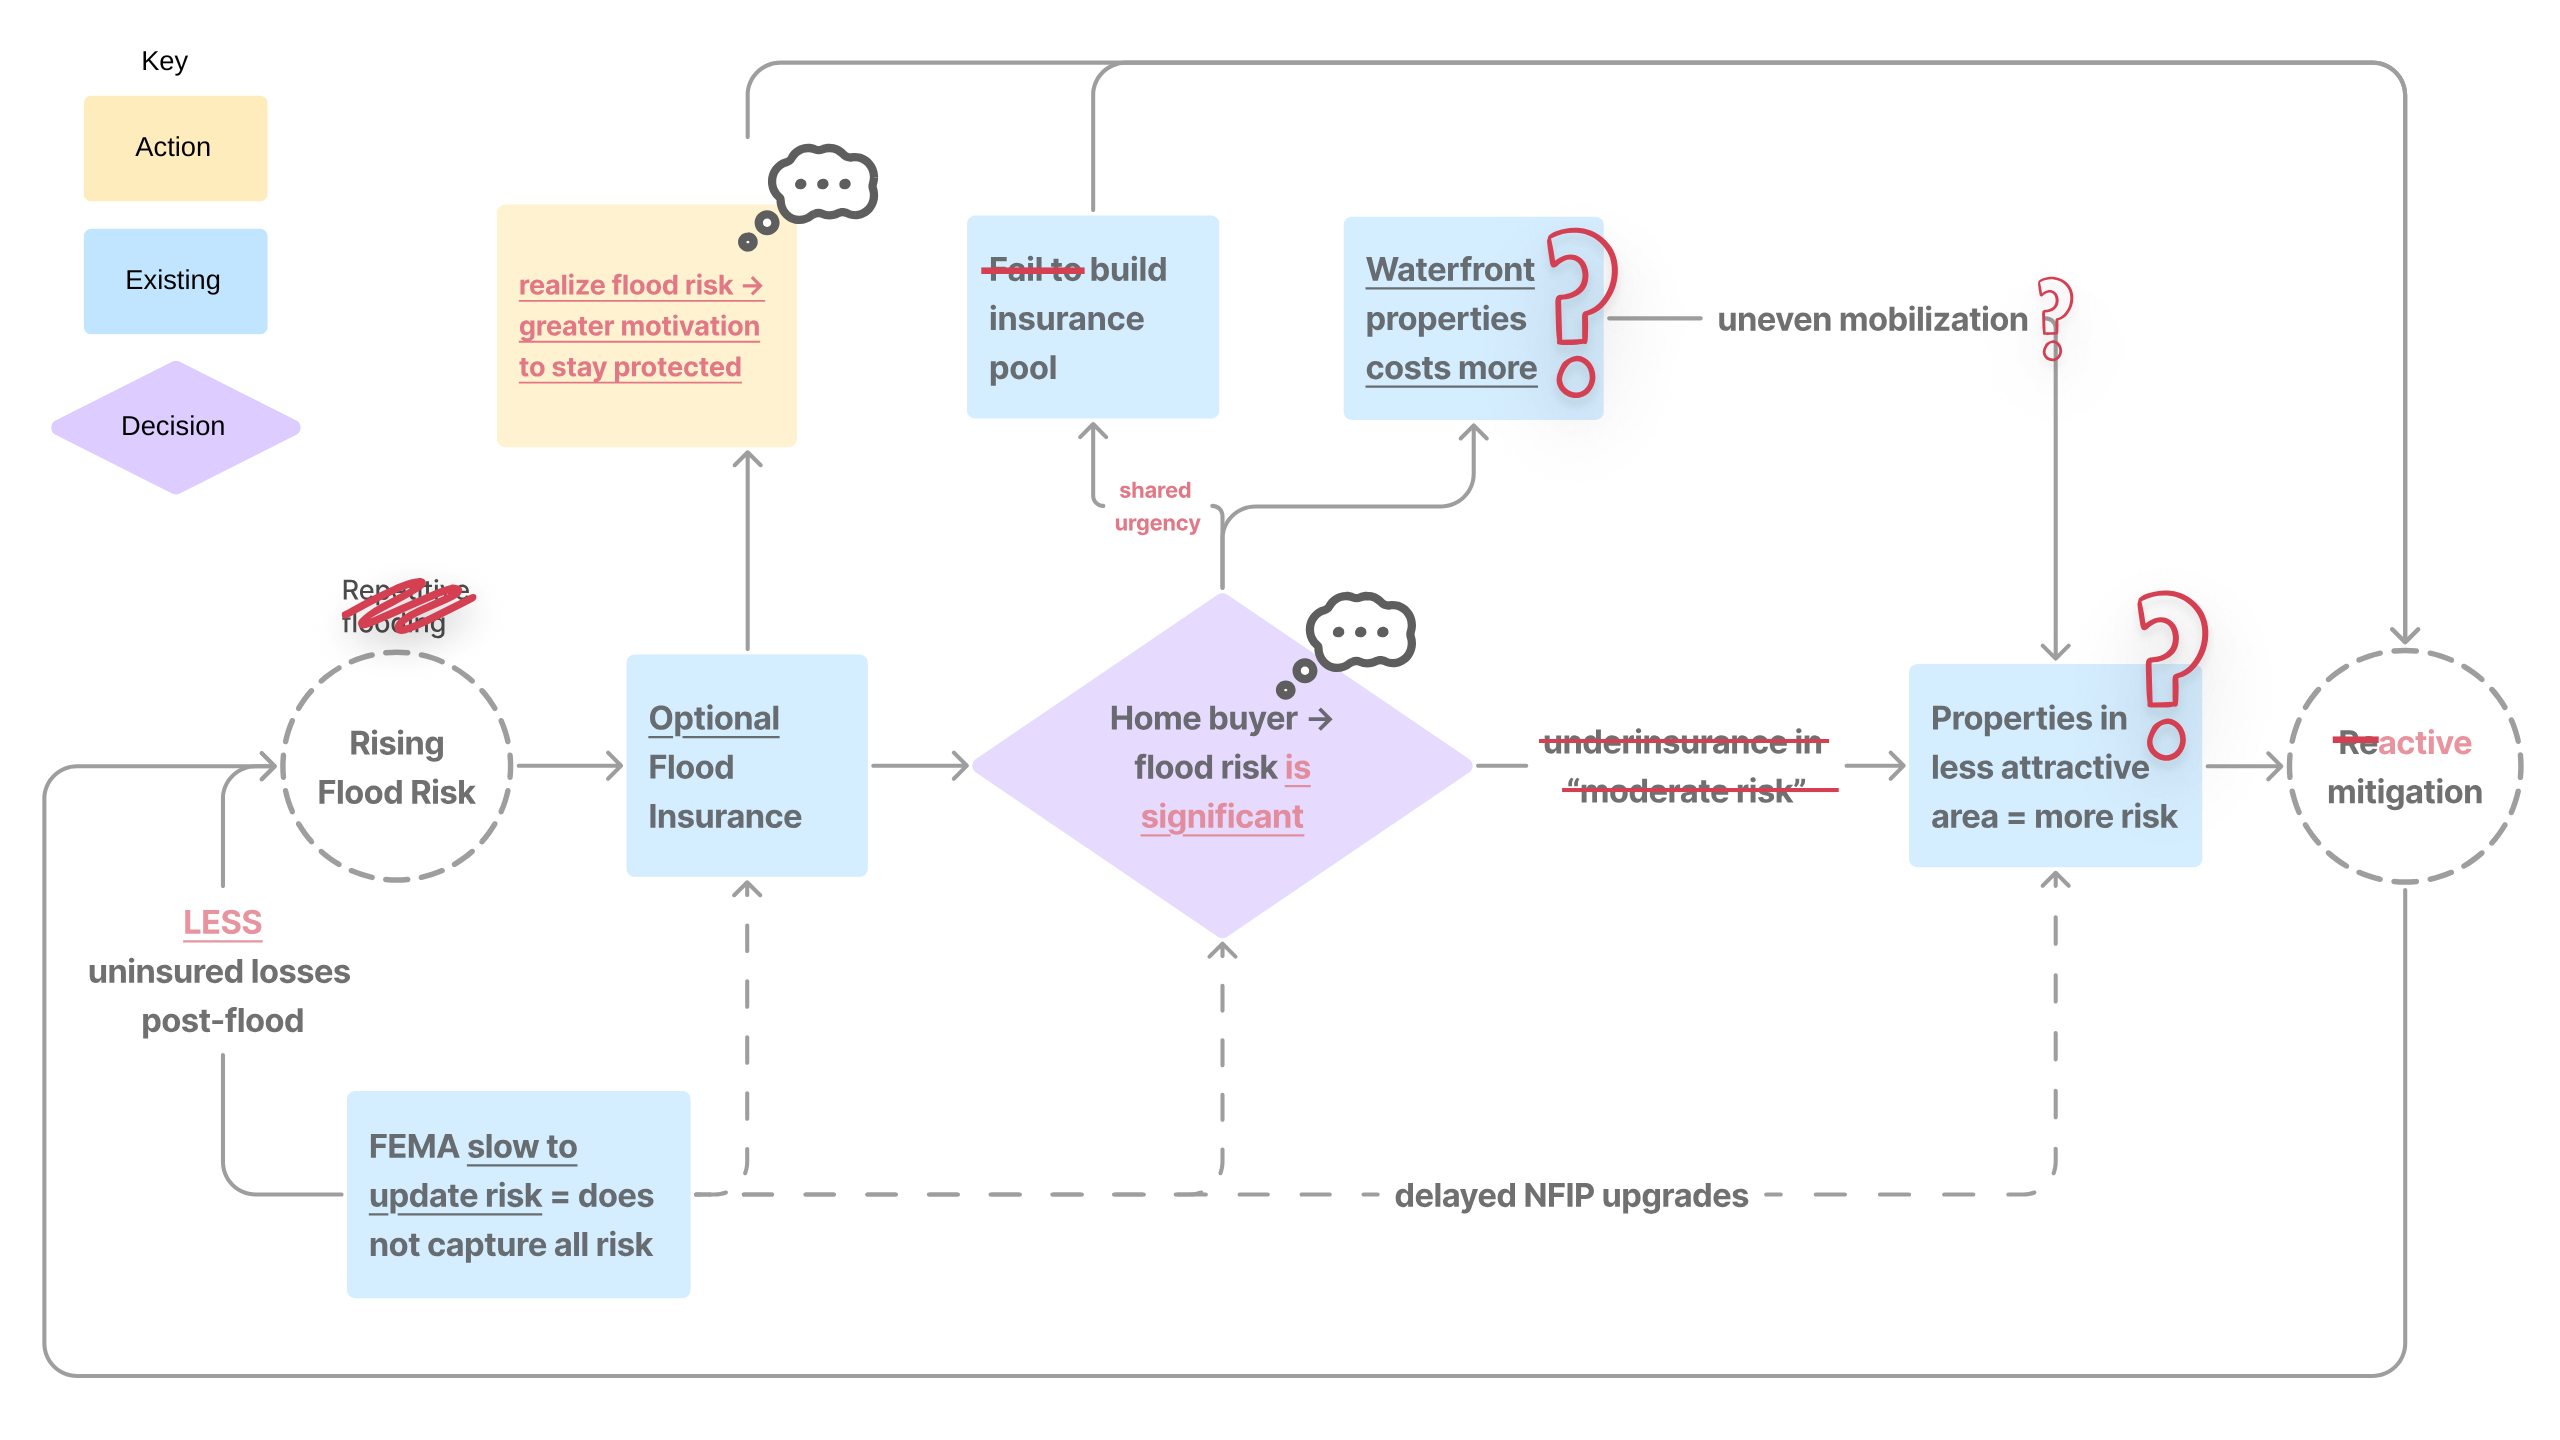
As of last month (April 2025), FEMA and other climate-related agencies are facing proposed federal funding cuts. If approved, these changes threaten to erode the tools and research we rely on to build resilience—especially in frontline communities with fewer resources.
When the cost of disasters outpaces the capacity of states to respond, it’s not just infrastructure that’s at risk—it’s our ability to act collectively and proactively.
⸻
Behind The Platform
⸻
Advisor Acknowledgements
James Piacentini, Snoweria Zhang, Mario Giampieri, Dare Brawley, Jonathan Stiles, Laura Kurgan, Catherine Griffiths, Seth Thompson
⸻
Resources & References
Cevik, S. (2022). Climate change and housing markets: A policy agenda for developing economies. Journal of Risk and Financial Management, 15(10), 434. https://www.mdpi.com/1911-8074/15/10/434
Enterprise Community Partners. (n.d.). Portfolio Protect. https://www.enterprisecommunity.org/impact-areas/resilience/portfolio-protect
First Street Foundation. (2020). The First National Flood Risk Assessment: Defining America’s Growing Risk. First Street Foundation, Inc. https://assets.firststreet.org/uploads/2020/06/first_street_foundation__first_national_flood_risk_assessment.pdf
Fuerst, F., & Warren-Myers, G. (2021). Pricing climate risk: Are flooding and sea level rise risk capitalised in Australian residential property? Climate Risk Management, 34, 100361. https://doi.org/10.1016/j.crm.2021.100361
Gourevitch, J. D., Kousky, C., Liao, Y. (P.), Nolte, C., Pollack, A. B., Porter, J. R., & Weill, J. A. (2023). Unpriced climate risk and the potential consequences of overvaluation in US housing markets. Nature Climate Change, 13, 250–257. https://doi.org/10.1038/s41558-023-01594-8
HomeLight. (n.d.). Home value estimator. https://www.homelight.com/home-value-estimator
New York City Office of the Mayor. (2013). A stronger, more resilient New York. Special Initiative for Rebuilding and Resiliency. https://www.nyc.gov/html/sirr/downloads/pdf/360497NY-New-York-City.pdf
New York City Panel on Climate Change. (n.d.). Extreme rainfall. NYC Climate. https://climate.cityofnewyork.us/challenges/extreme-rainfall/
TheyRule. (n.d.). They Rule. https://theyrule.net/
TIME. (2022, October 3). The towns trying to climate-proof themselves against extreme weather. https://time.com/6225970/climate-proof-towns-extreme-weather/
U.S. Army Corps of Engineers. (n.d.). Levee map viewer. https://levees.sec.usace.army.mil/map-viewer/index.html
U.S. Federal Emergency Management Agency. (n.d.-a). FEMA Map Service Center. https://msc.fema.gov/portal/home
U.S. Federal Emergency Management Agency. (n.d.-b). NFHL Google Earth guide. https://hazards.fema.gov/femaportal/kmz/NFHL_Google_Earth_Guide.pdf
Zoning and Land Use Data, NYC Department of Finance. (n.d.). Annualized sales update. NYC Open Data. https://www.nyc.gov/site/finance/property/property-annualized-sales-update.page#
e-flux. (2024). House Tech. e-flux Architecture: Spatial Computing. https://www.e-flux.com/architecture/spatial-computing/611246/house-tech/
ATTOM. (n.d.). Property data API. https://api.developer.attomdata.com/login