Trench: Computational Design Practice for Environmental Justice in the South Bronx
Sriya Thotakura
The Cross Bronx Expressway displaced over 60,000 South Bronx residents when Robert Moses cut a 6.3-mile trench through the borough's densest neighborhoods between 1948 and 1972[1]. Seventy years later, the trench remains — not as a historical artifact but as an active instrument of environmental harm. Its canyon geometry traps diesel particulate matter, amplifies noise, elevates surface temperatures, and concentrates respiratory illness in communities already defined by disinvestment[2]. This project asks what computational design practice can do about it — not as analysis alone, but as a method for integrating community testimony, spatial evidence, predictive modeling, and physical design intervention into a single actionable pipeline.
The work emerges from a specific disciplinary position within Columbia GSAPP's M.S. in Computational Design Practices. The program's thesis is that computation is not a neutral instrument of optimization but a design medium — one that carries assumptions about whose knowledge counts, whose environments are measured, and whose futures are modeled. This project tests that thesis against a real corridor, with real asthma data, real community board testimony, and real people living inside the trench.
- 139 documents indexed via retrieval-augmented generation, spanning Community Board minutes, NYC DOHMH health data, EPA EJScreen reports, and 199,980 311 complaints (2021–2024).
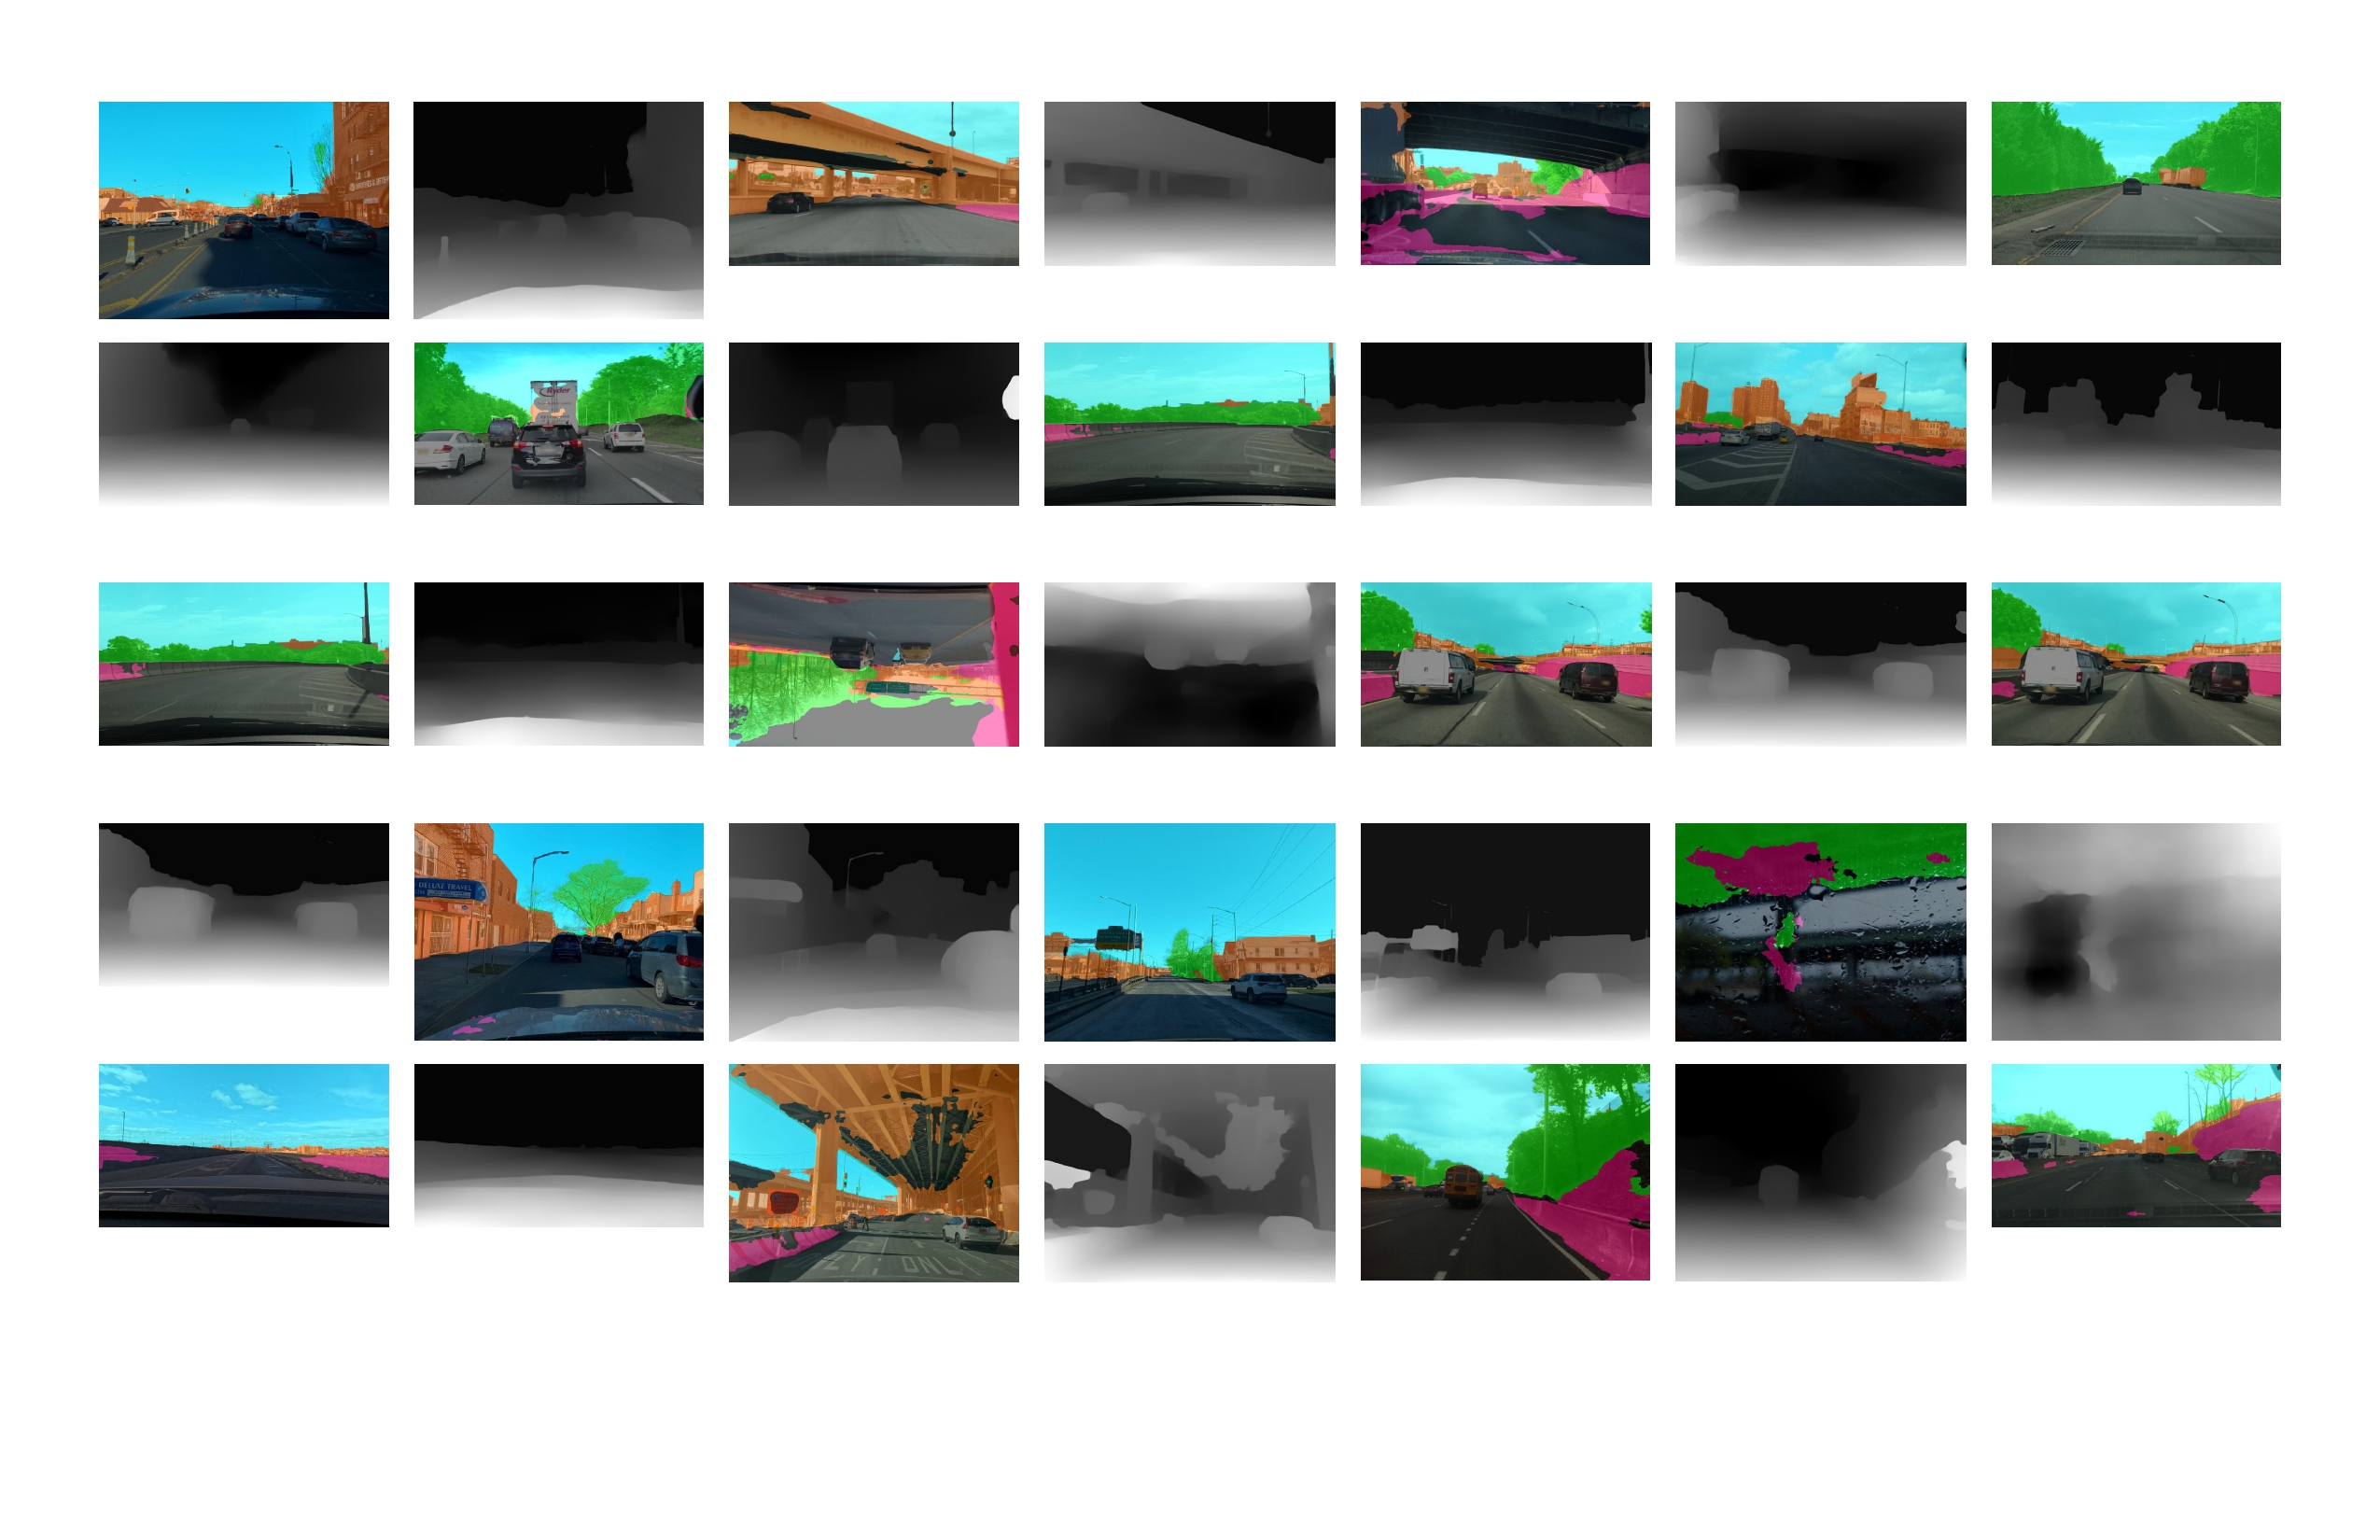
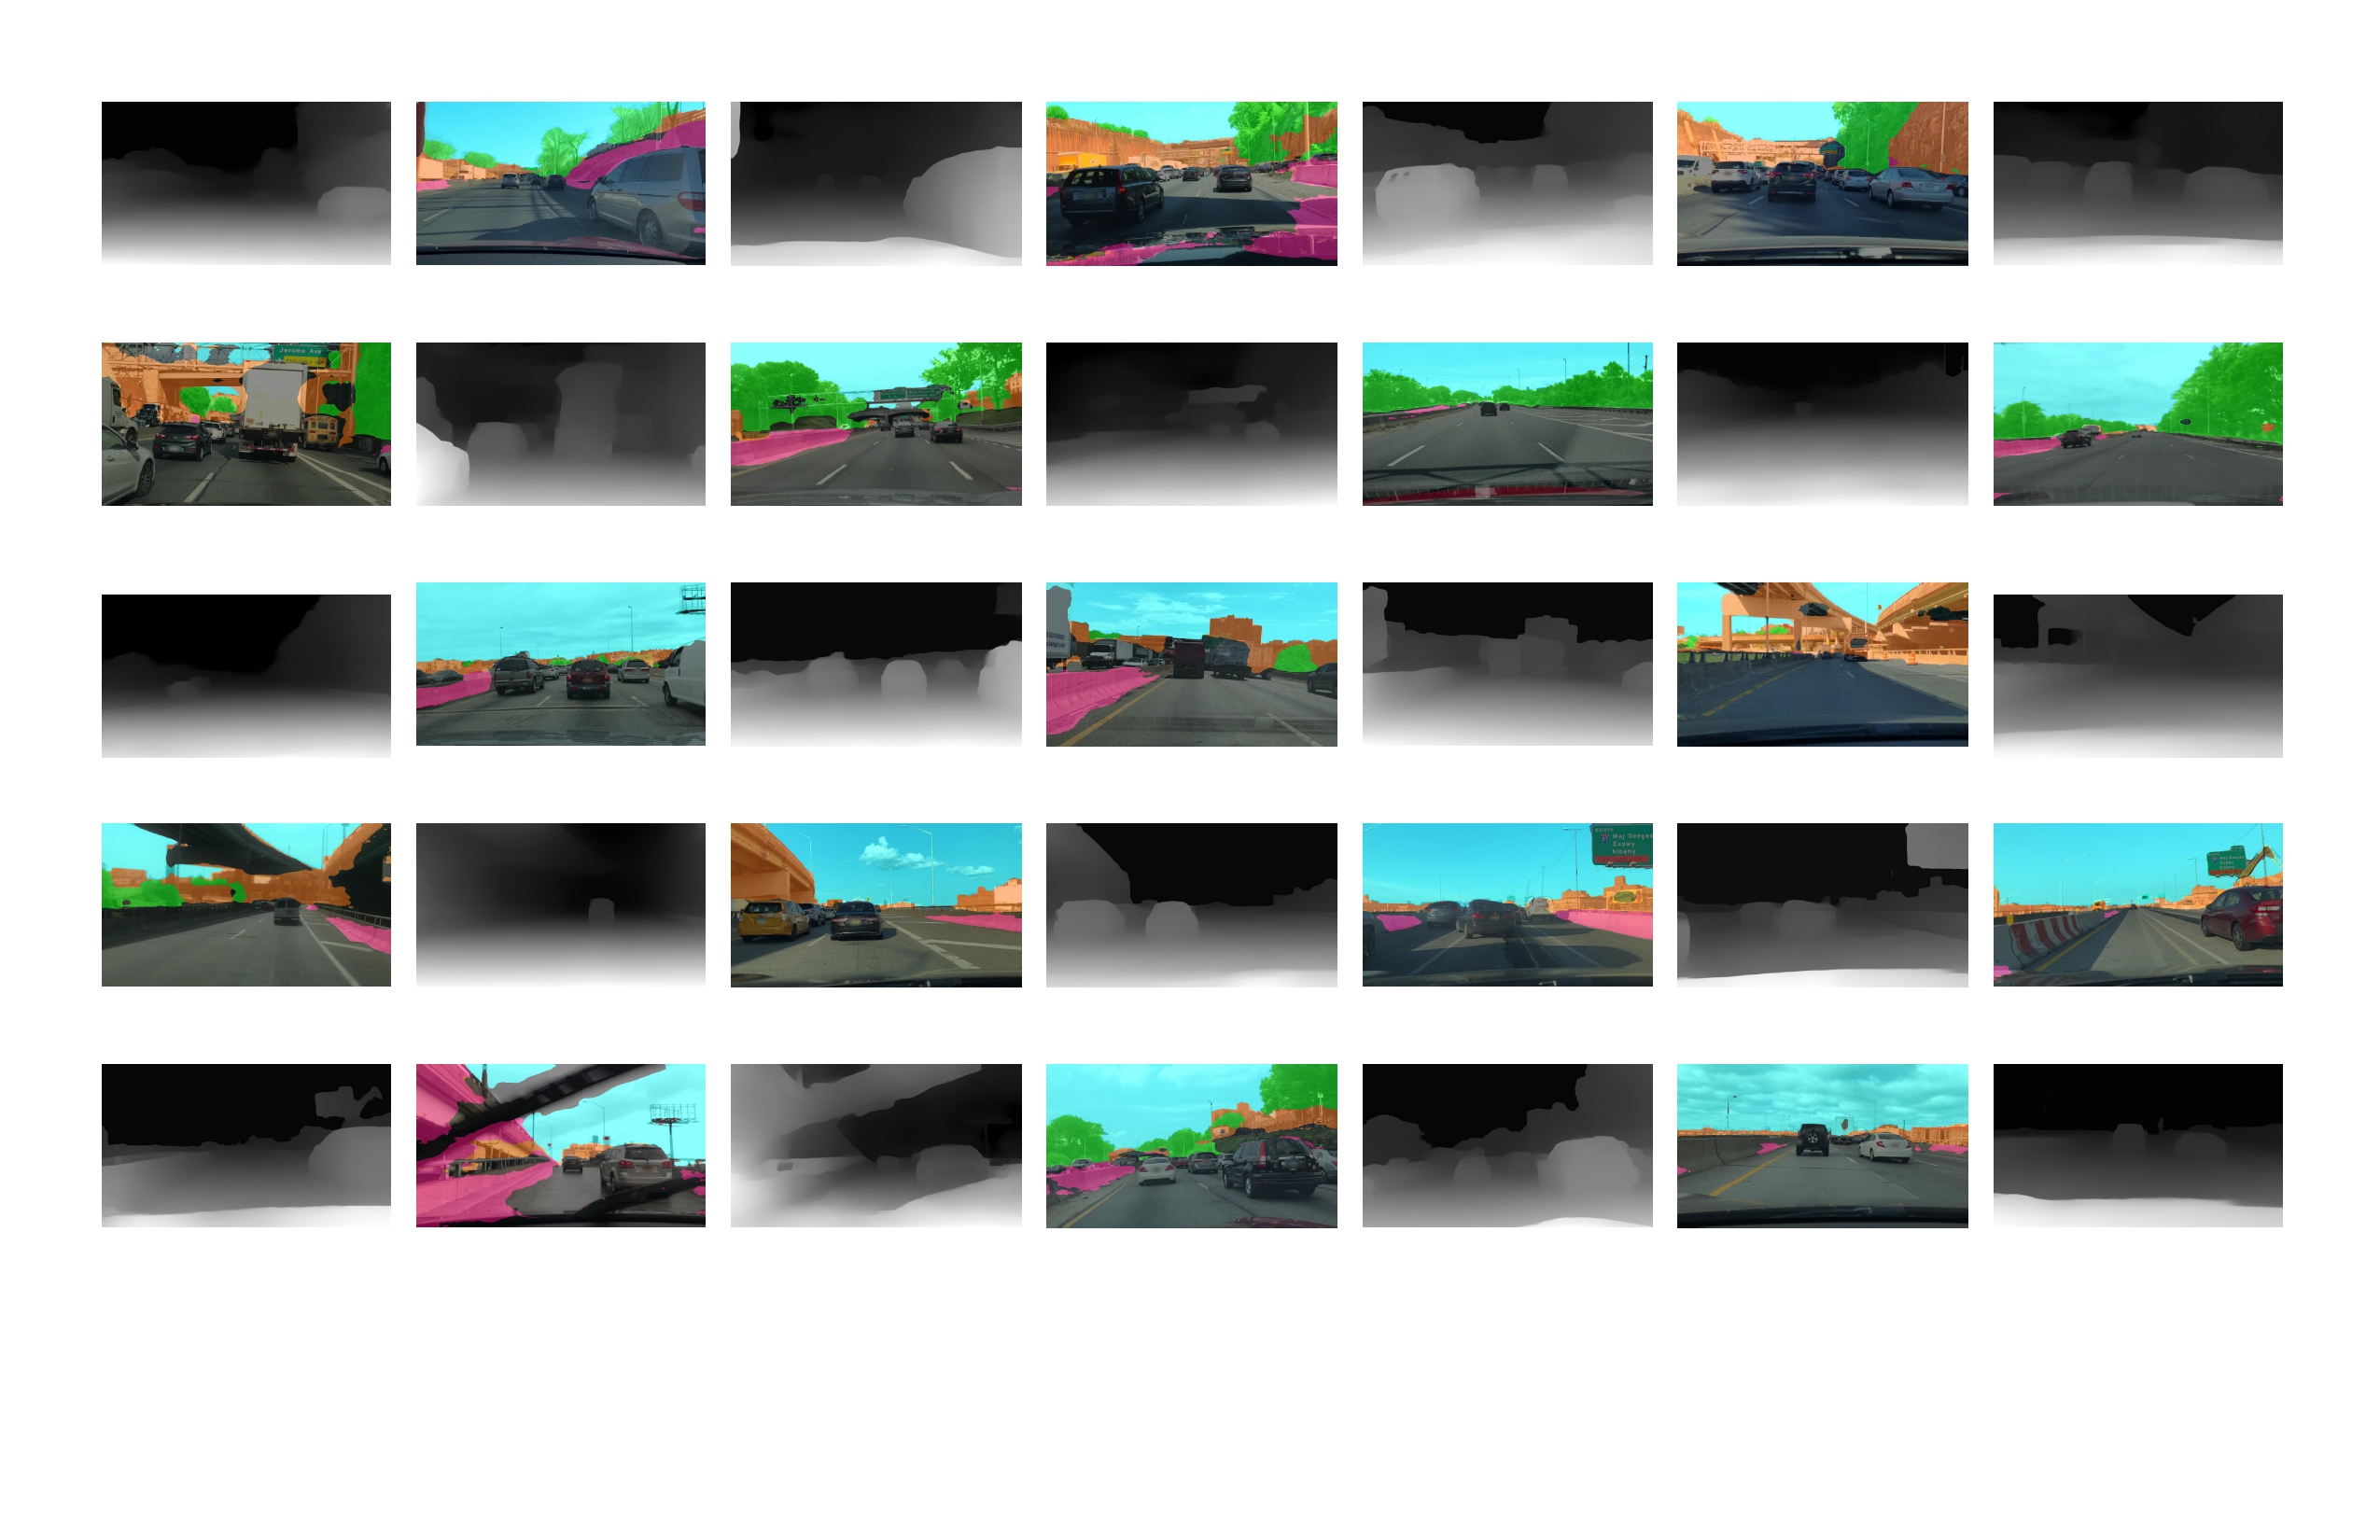
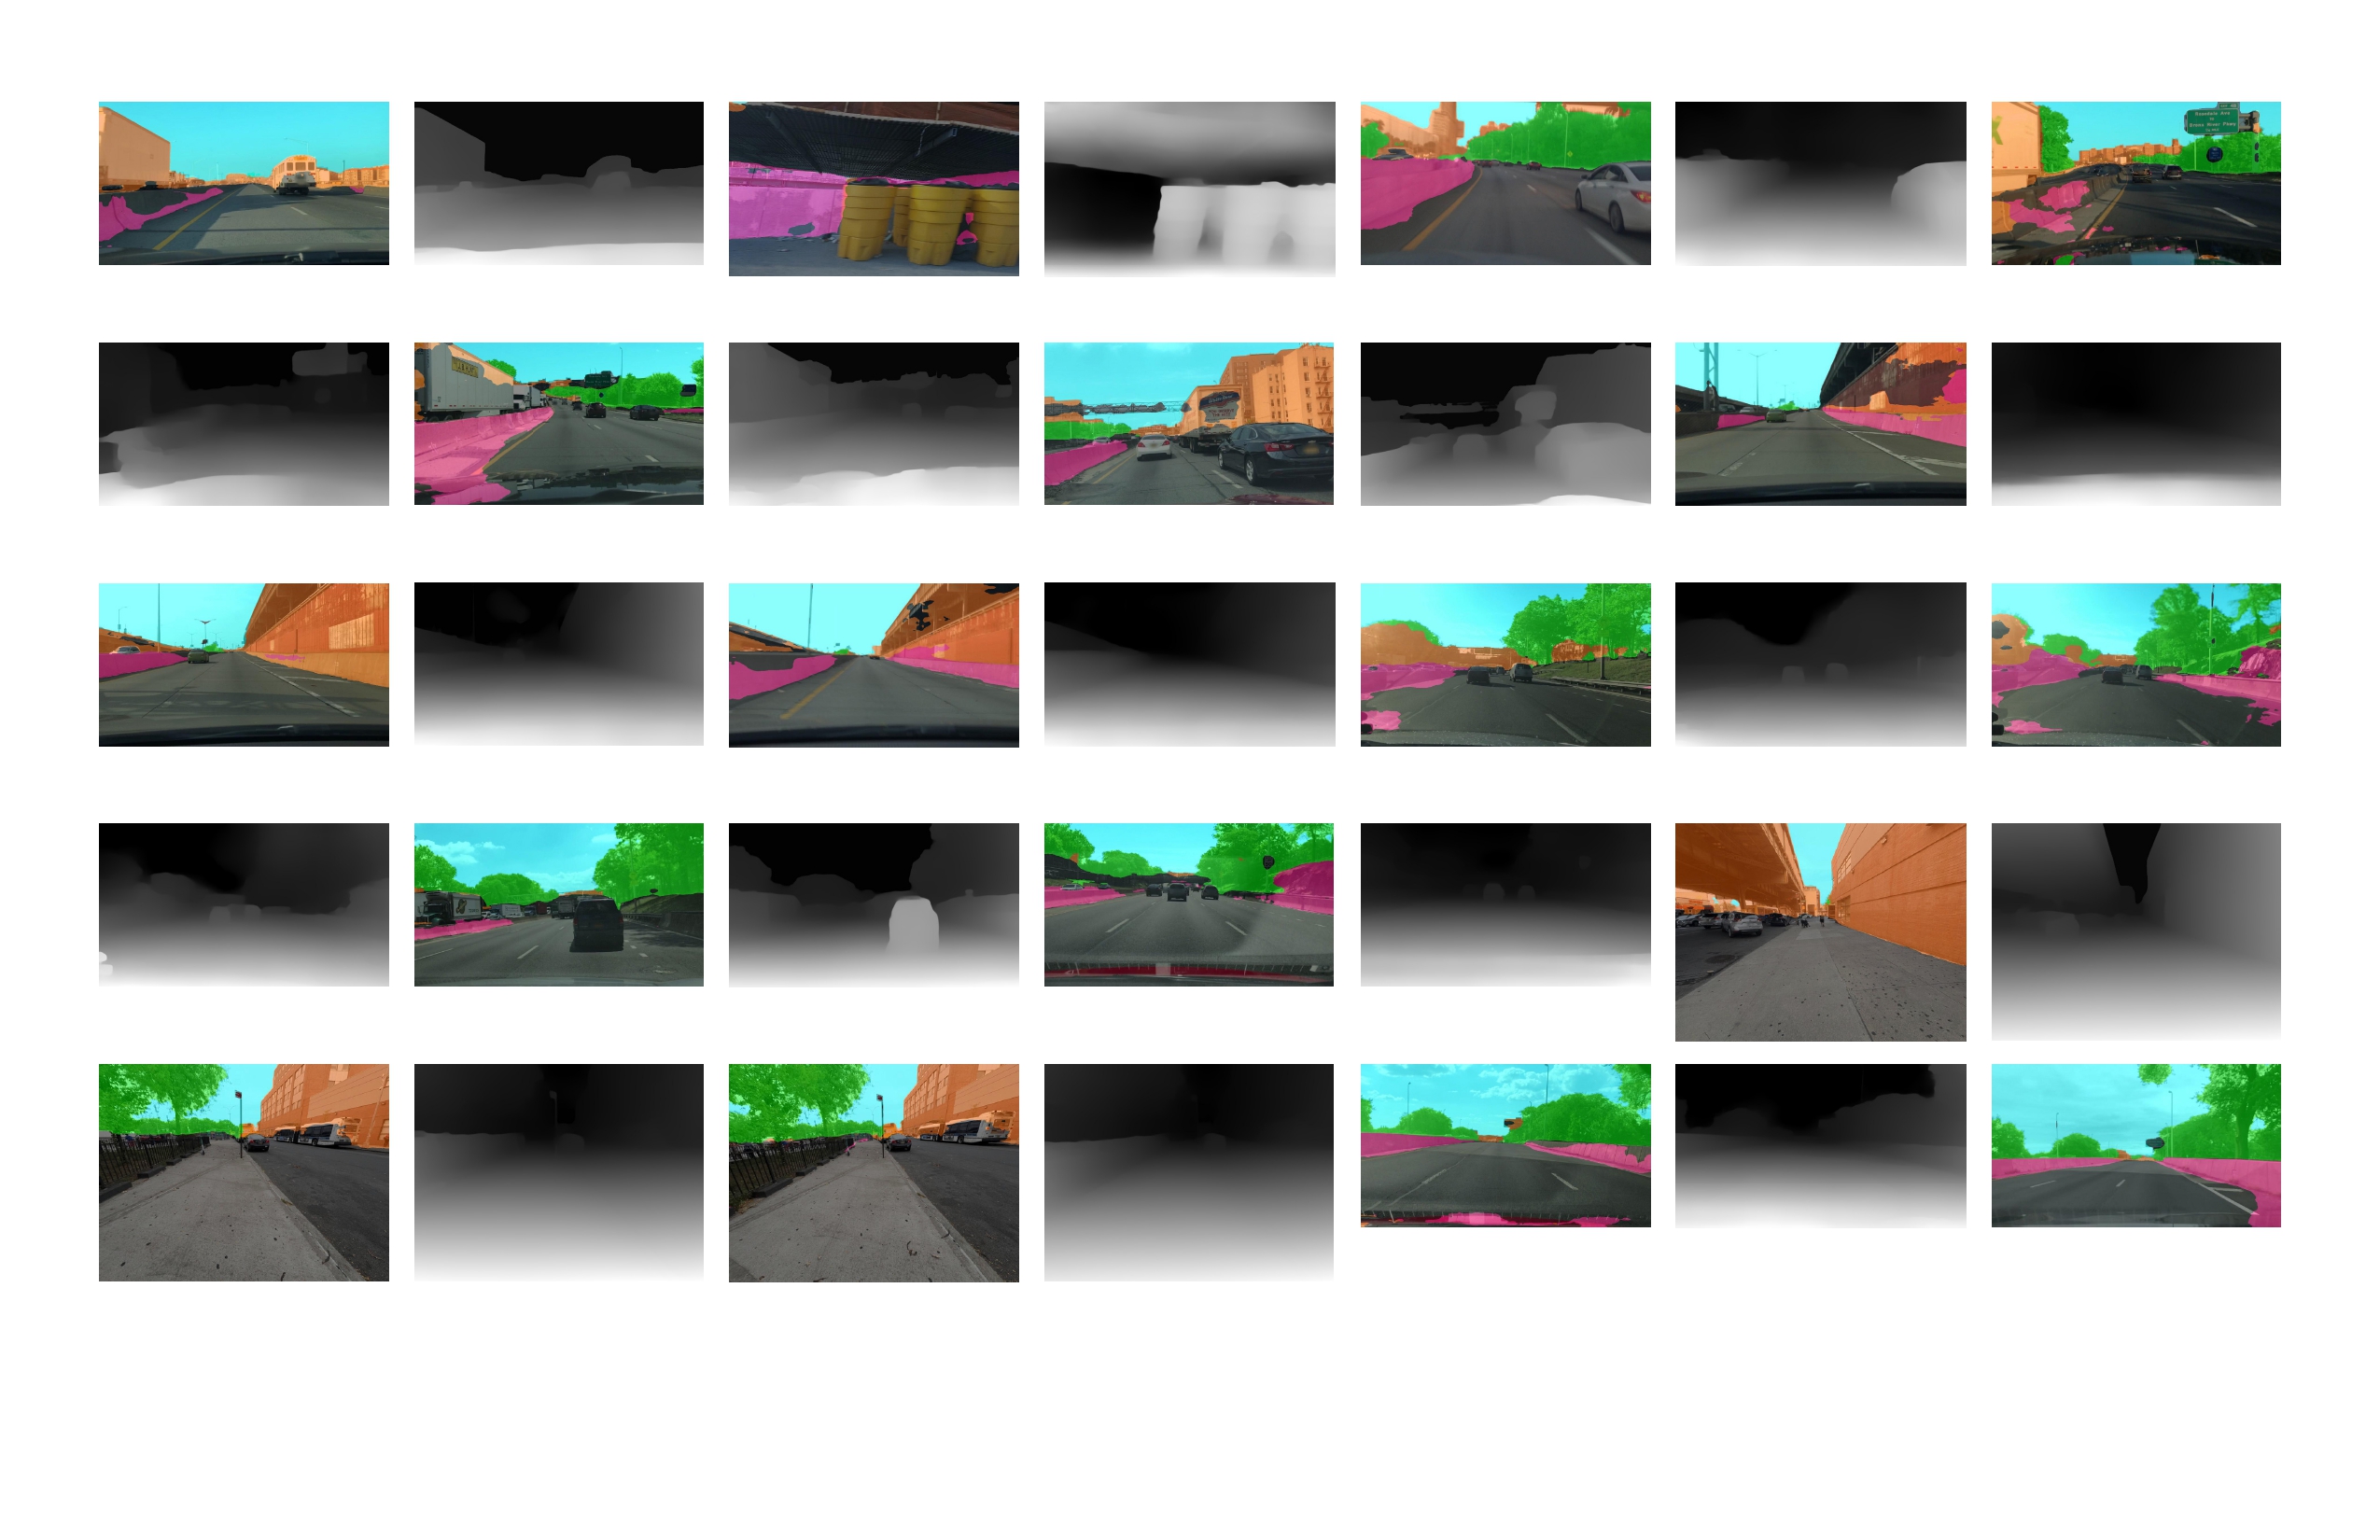
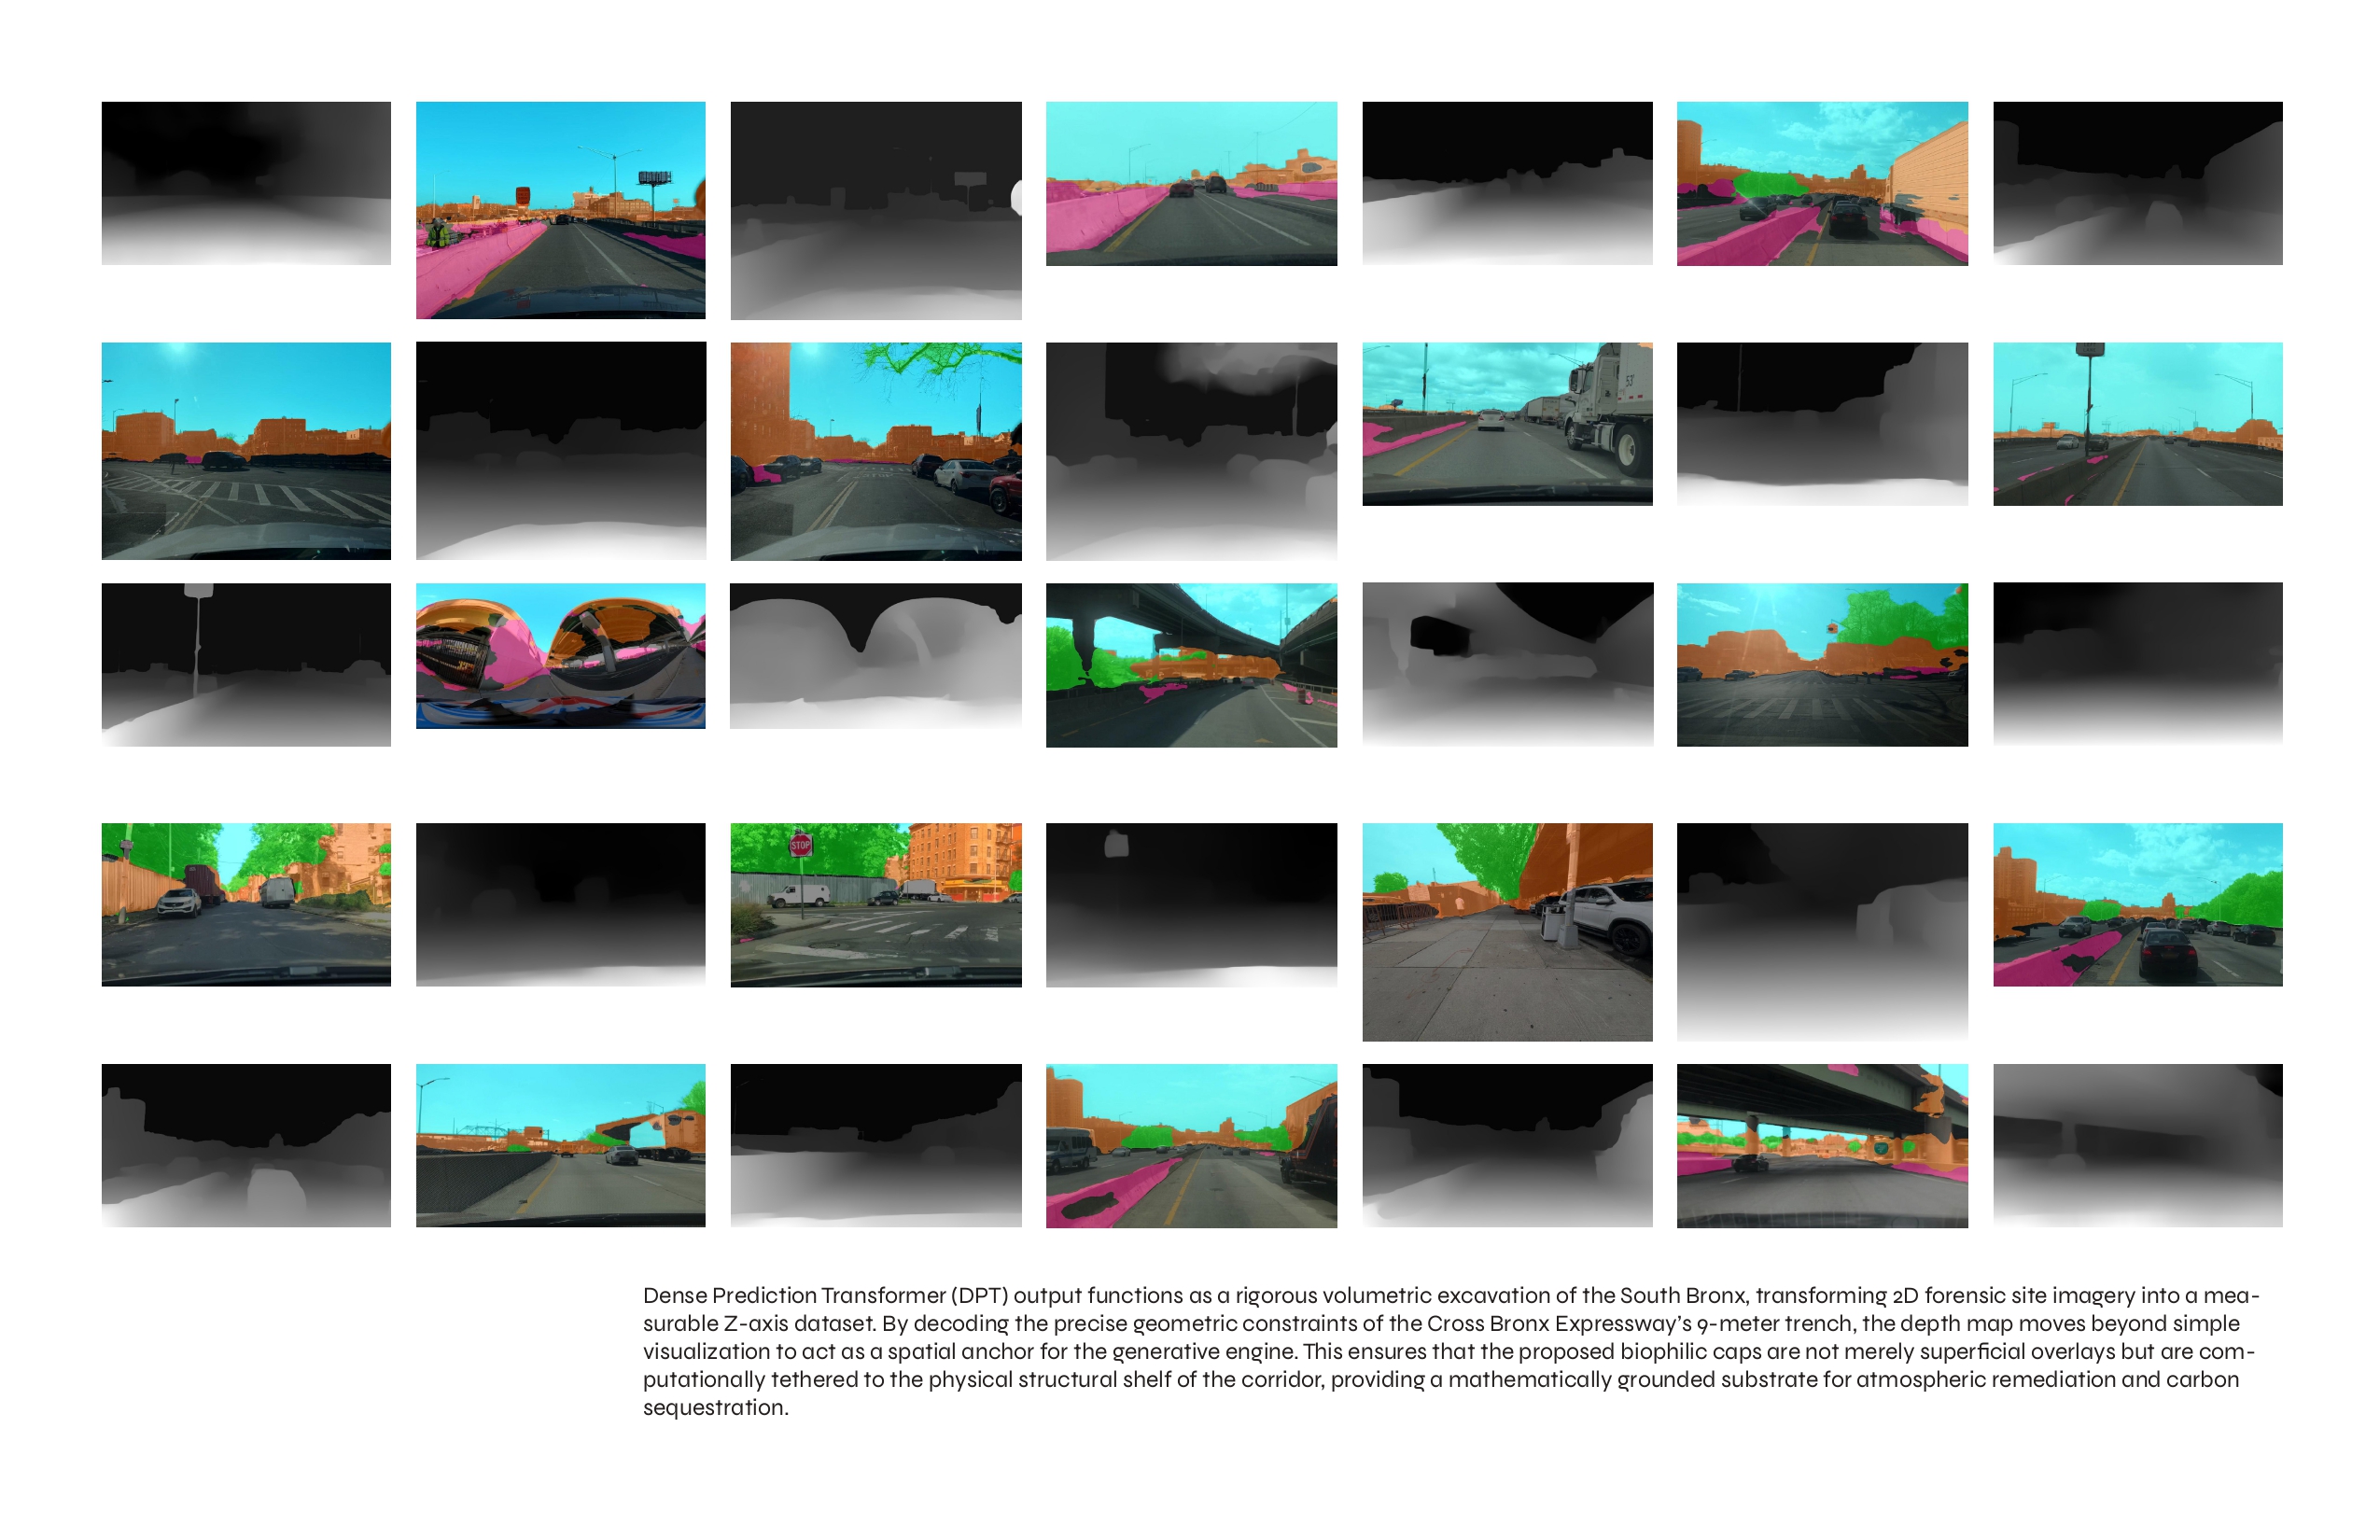
- 71 street-level frames segmented using SegFormer (ADE20K) to quantify sky ratio, wall enclosure, and canyon aspect ratios along the corridor.
- 57 analysis zones modeled through a weighted ensemble of Gradient Boosting, XGBoost, and Random Forest, identifying Mott Haven (fid-41) as the highest-vulnerability zone.
- 5 intervention sites selected for parametric trench cap proposals driven by wind score and community-reported trauma density.
Why computation needs community: the CommunityAtlas precedent
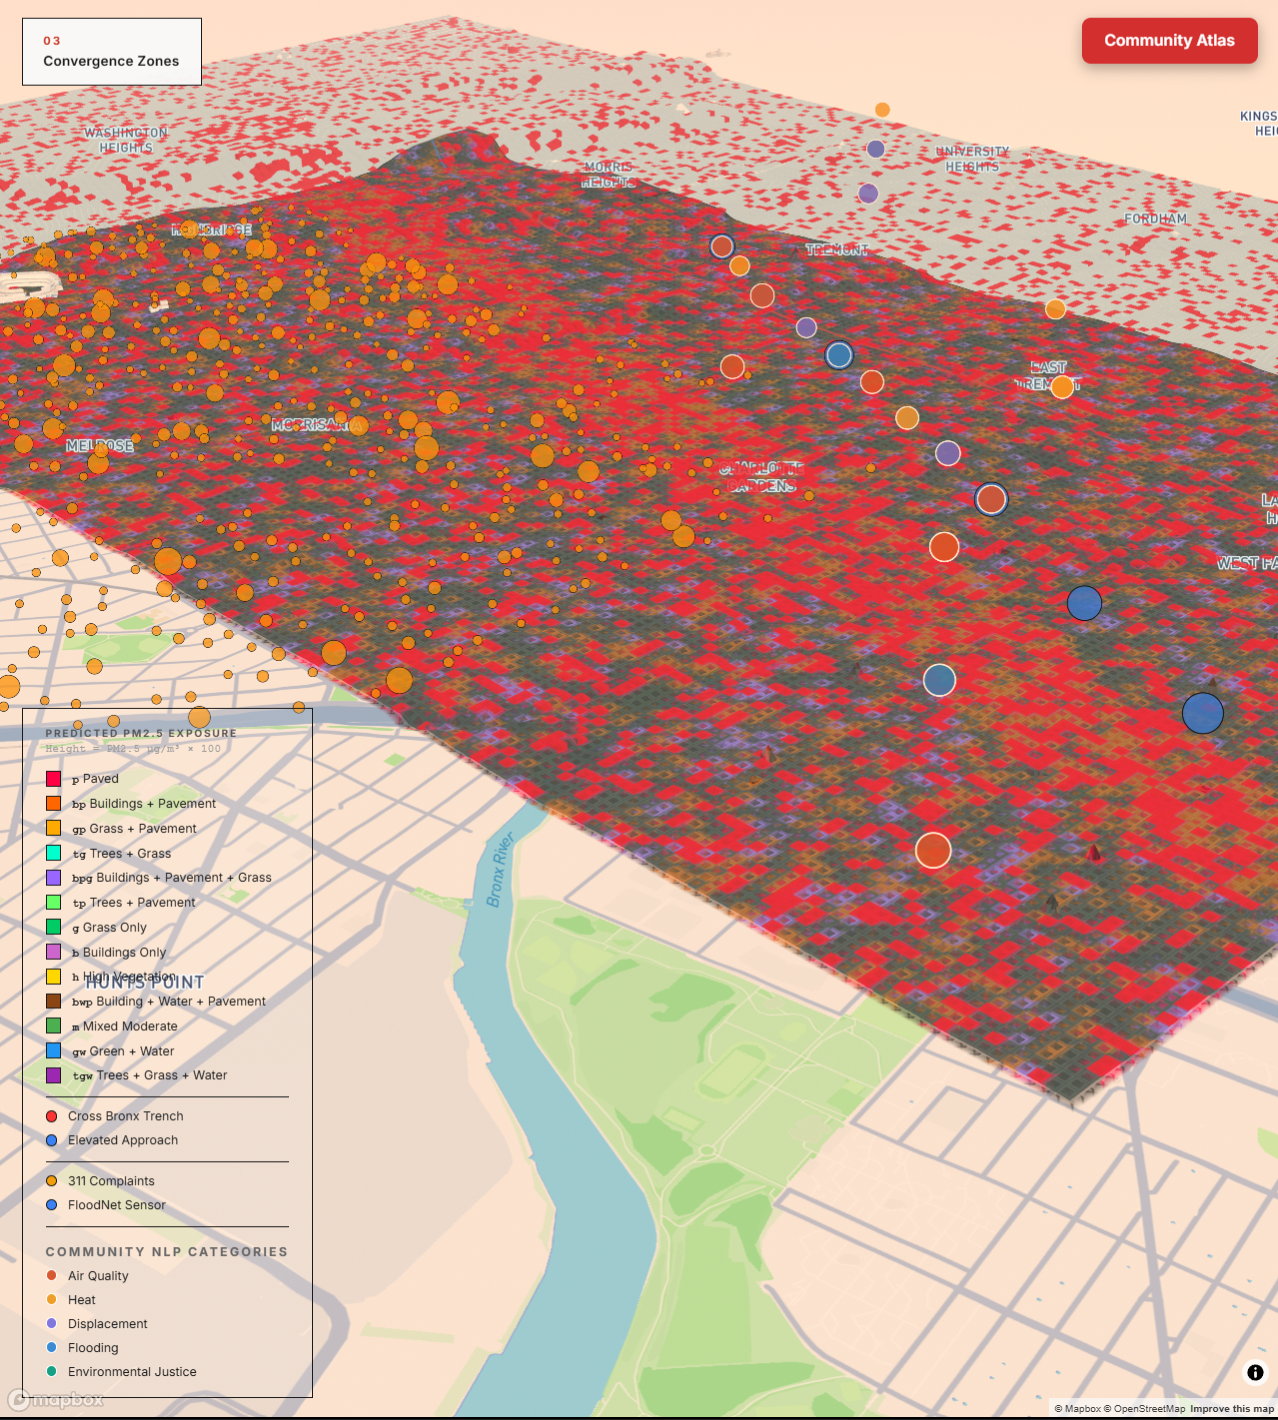
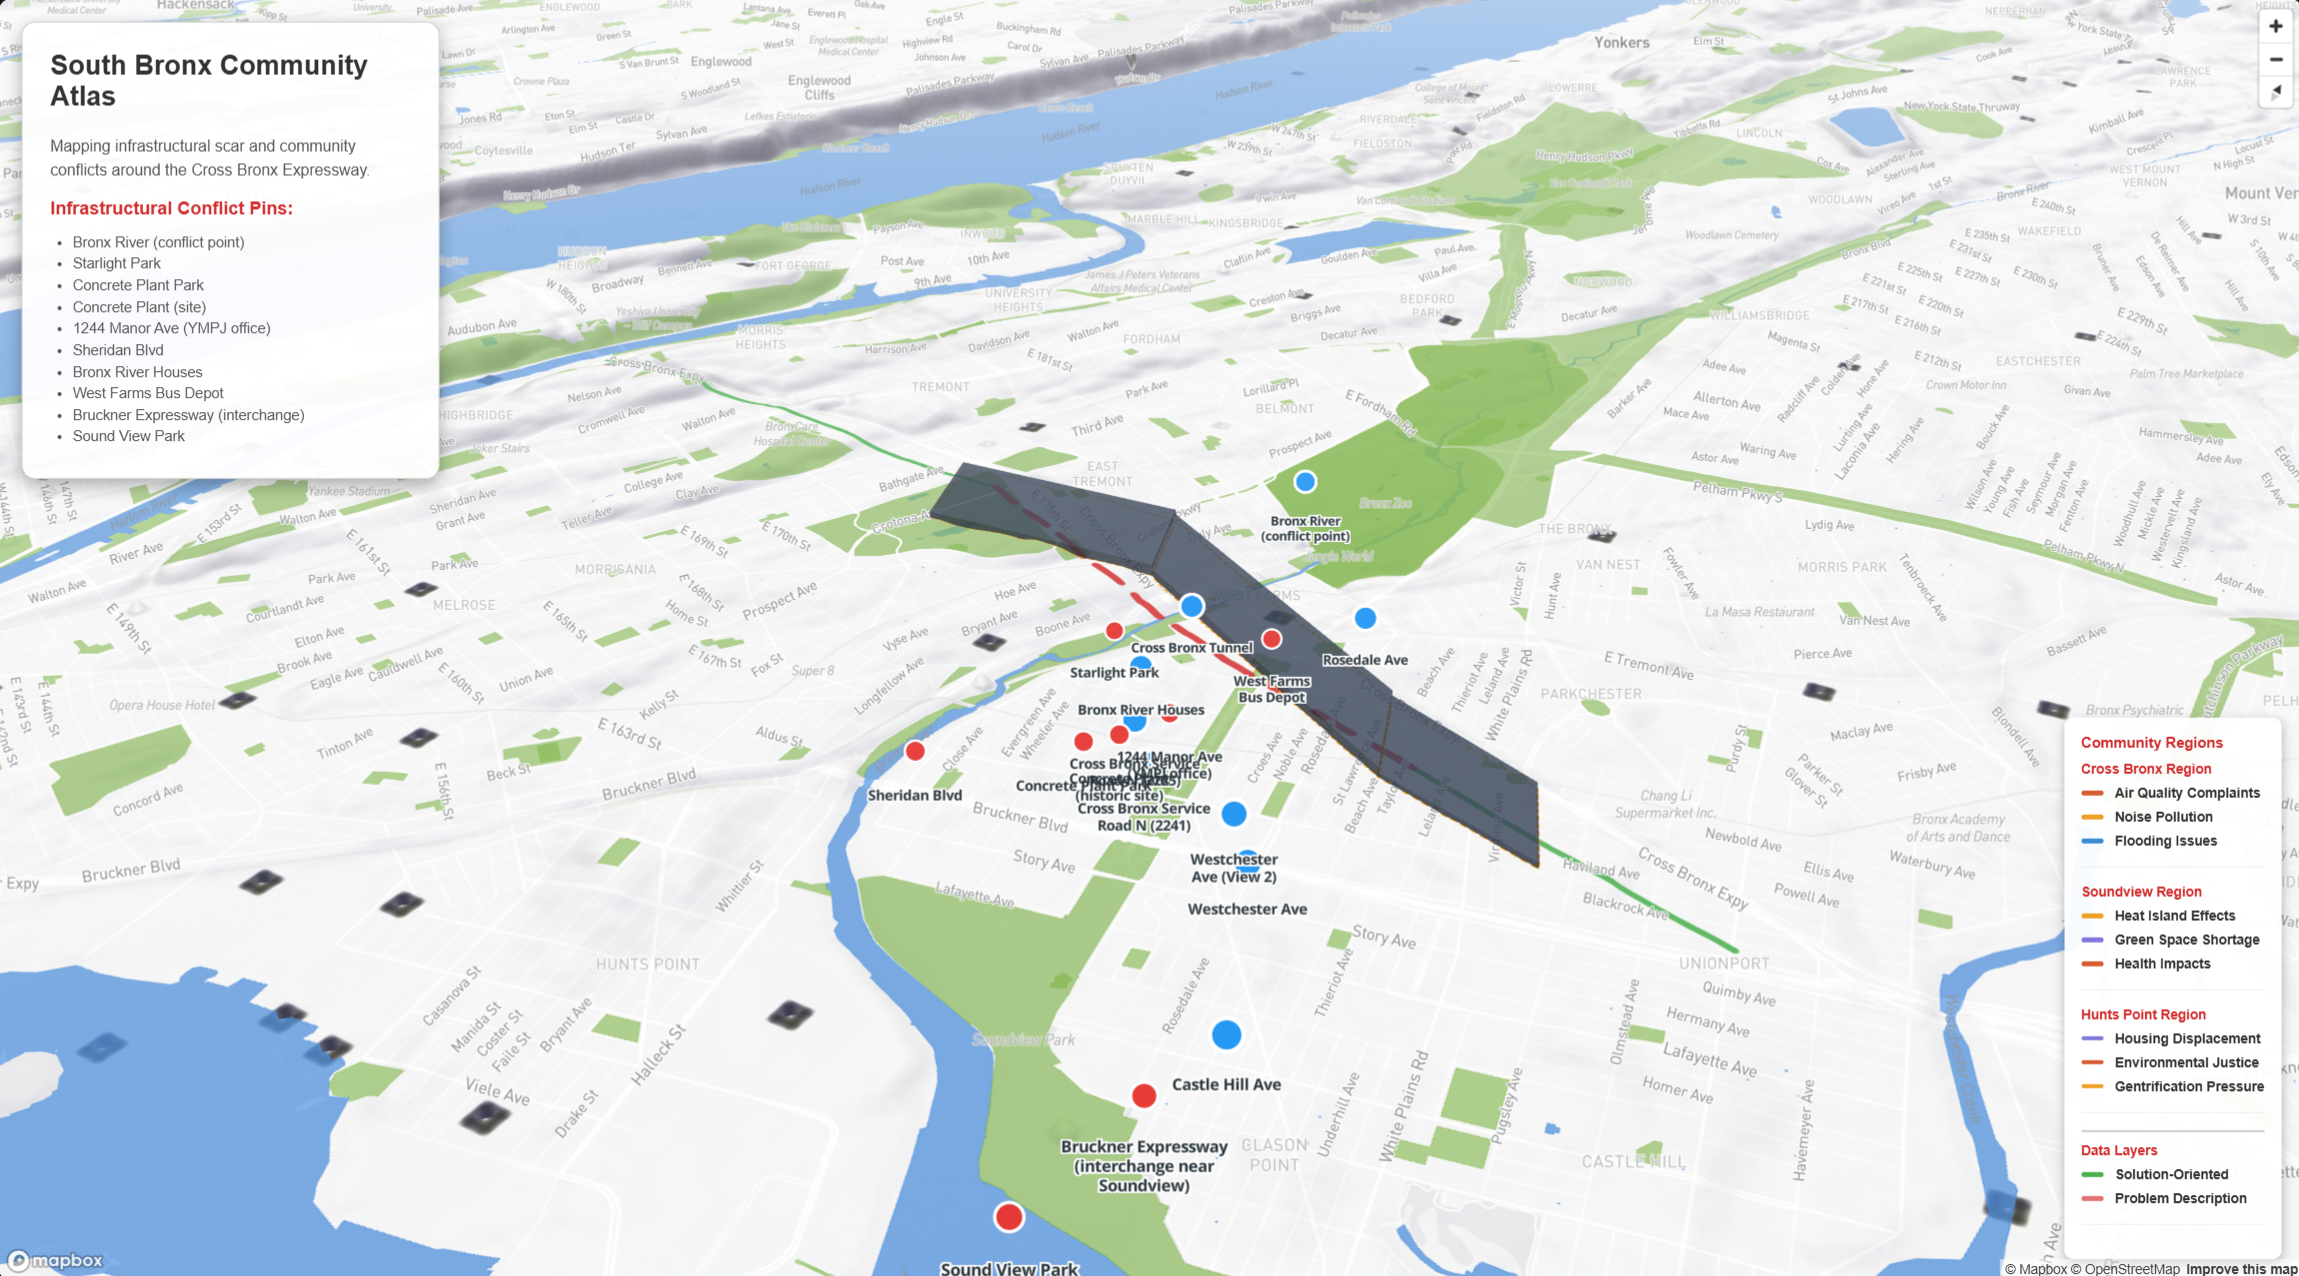
An earlier phase of this research, CommunityAtlas, applied the Structure of Urban Landscapes (STURLA) classification framework and Random Forest regression to map environmental vulnerability across the South Bronx[3]. The model achieved strong predictive performance — distance to the CBX corridor emerged as the single most important feature at 100% relative importance. But the target variable was synthetic: PM2.5 concentrations were interpolated from sparse EPA monitoring stations, not measured at street level. The model could identify where vulnerability concentrates but not why residents experience it the way they do, or what they say about it in their own words.
This is the fundamental limitation of purely data-driven approaches to urban environmental justice. Machine learning can rank features, draw boundaries, and predict scores — but without a community-intervened layer, it operates on institutional data alone. Health department statistics, census demographics, and remote-sensed imagery describe conditions from above. They do not capture the mother in Hunts Point who keeps her windows sealed in July because the truck fumes are worse than the heat, or the community board member who has testified about the same noise complaint for six consecutive years with "action taken: none" as the recorded outcome[4].
The computational design practice articulated in this project addresses that gap. It does not discard quantitative methods — it layers community testimony into them as a first-class data stream, weighted alongside GIS indicators and health statistics in the same ensemble model. RAG-extracted trauma features account for 10.8% of the model's predictive power — below the 20% threshold for a novel finding in isolation, but significant given that 79% of analysis zones had zero trauma data coverage. The signal is there. The corpus gap is the finding.
The computational pipeline: seven layers addressing urban decay
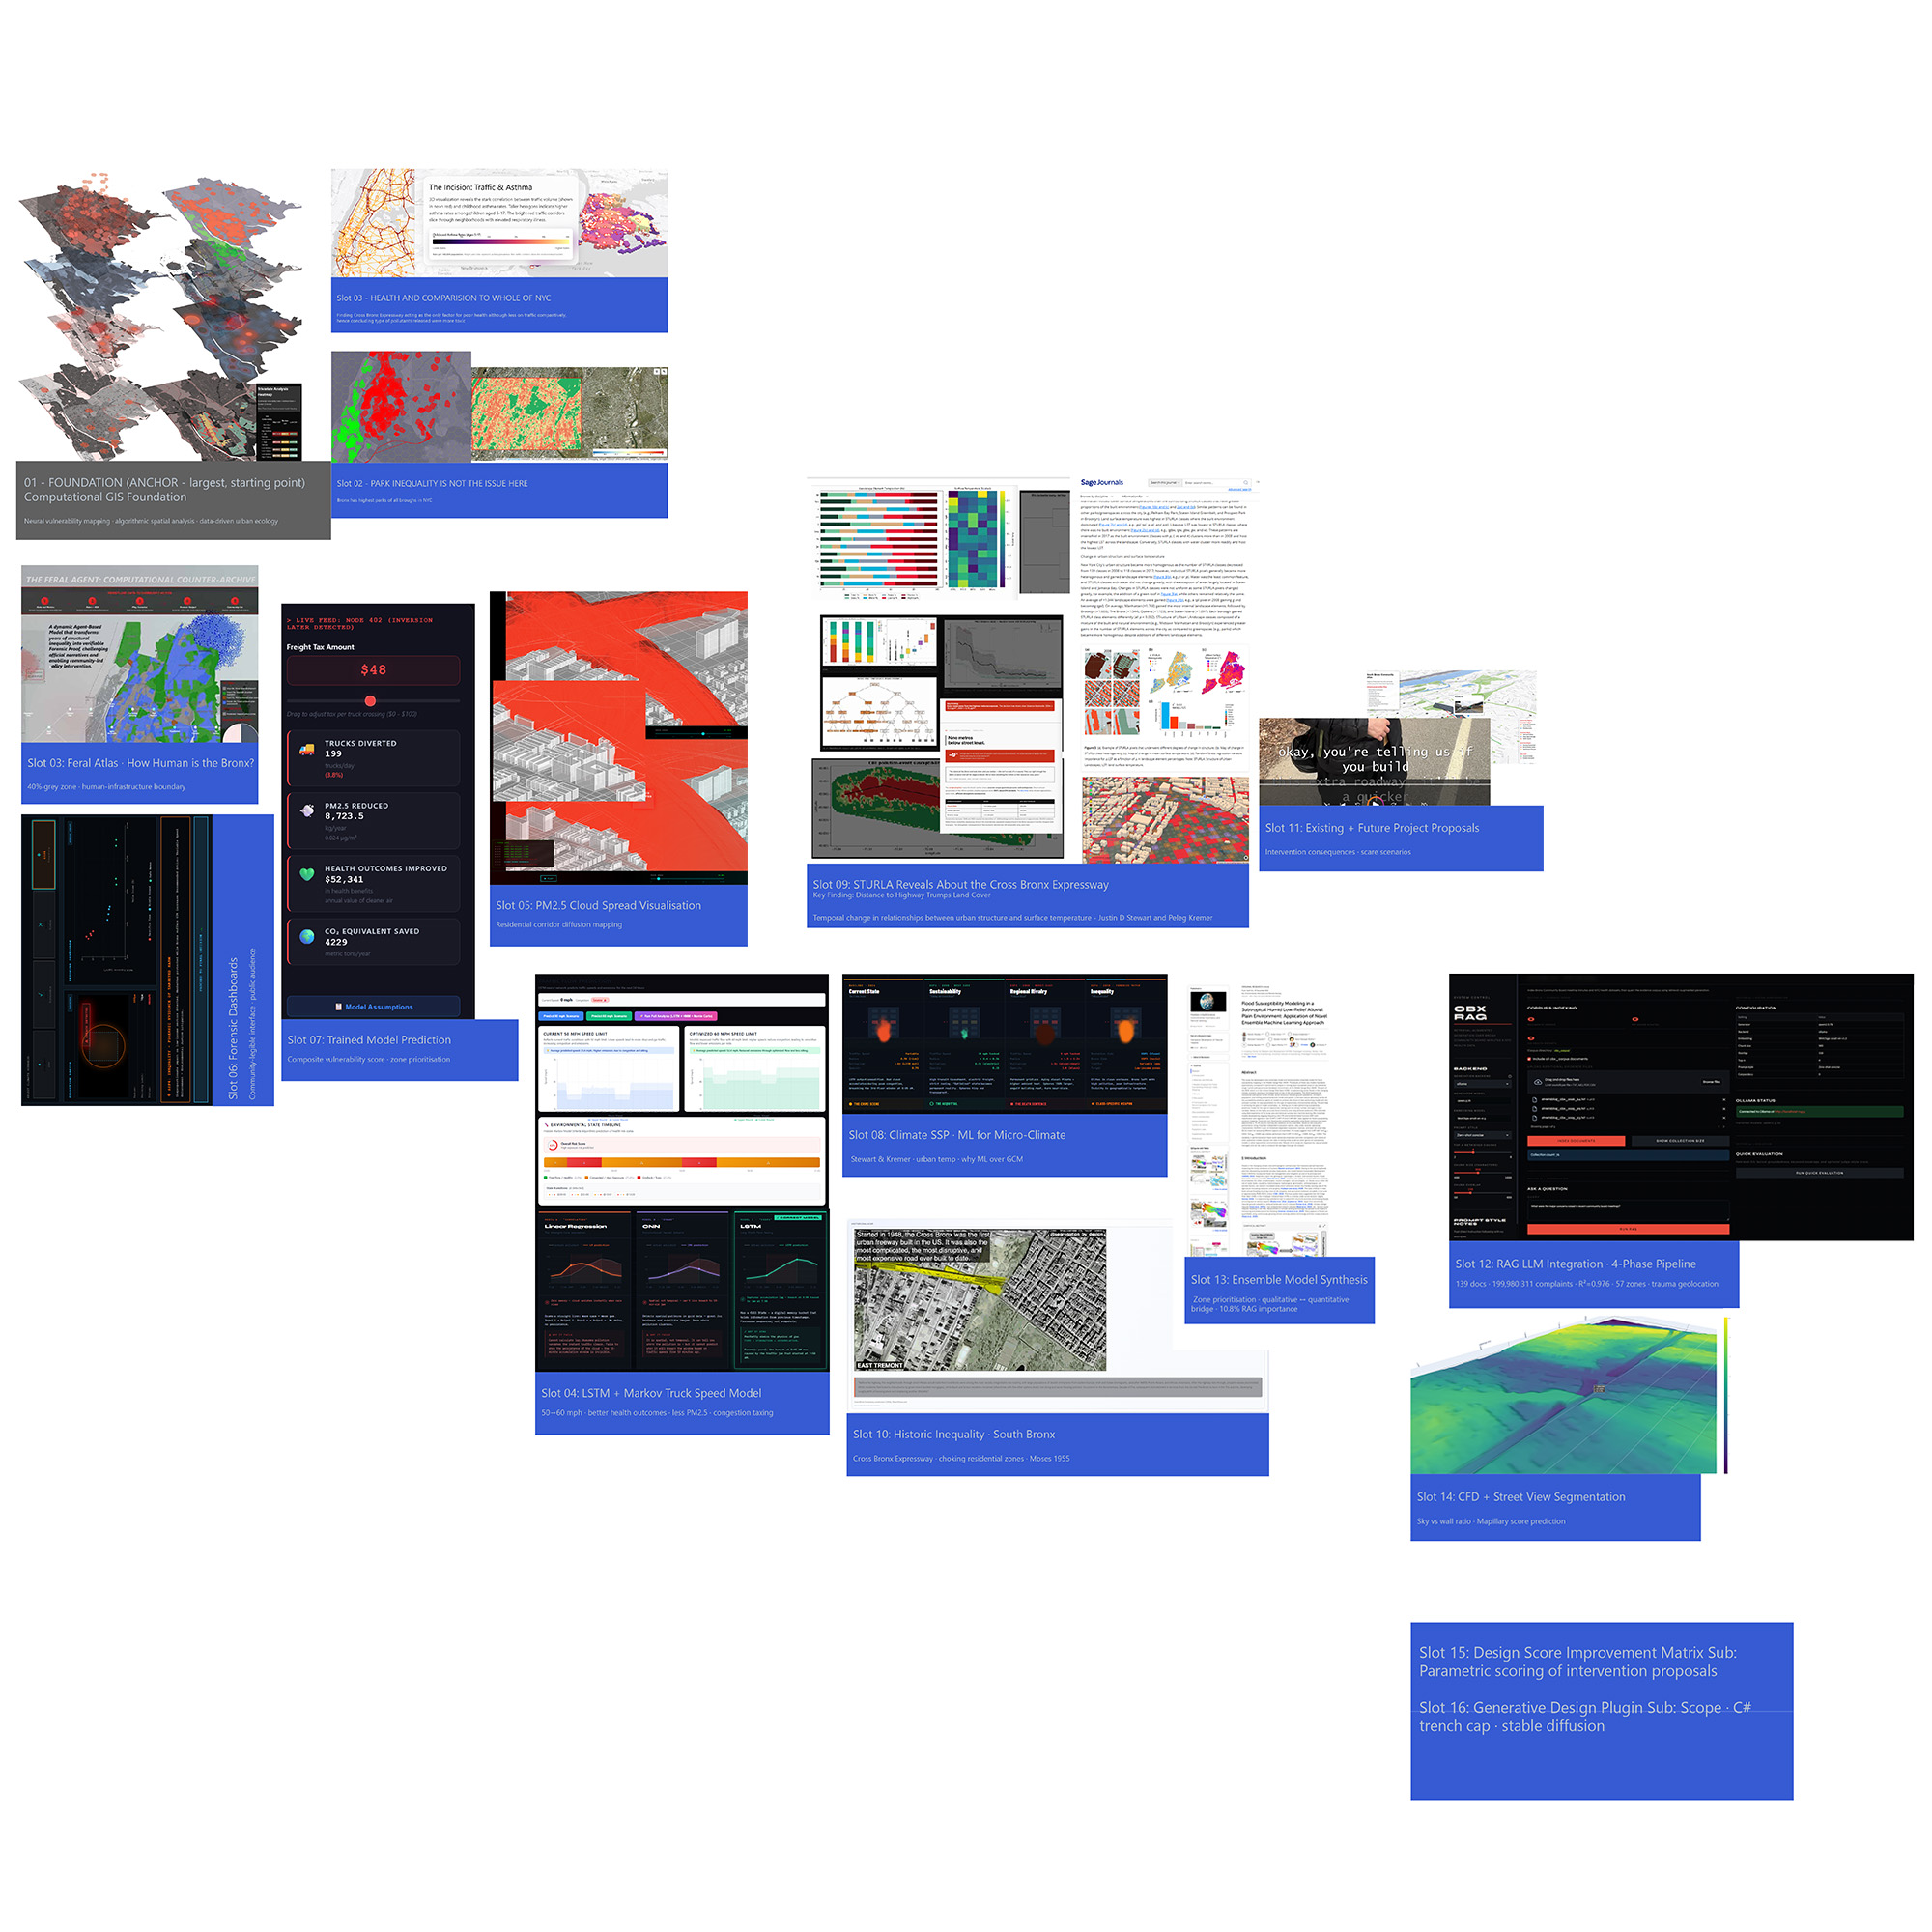
Urban decay at the scale of the Cross Bronx Expressway cannot be addressed by a single computational method. The trench is simultaneously a geometric condition (measurable by computer vision), a health crisis (quantifiable through epidemiological data), a governance failure (documented in community board minutes), a spatial injustice (mappable through GIS), and a design problem (addressable through parametric intervention). This project constructs a seven-layer computational pipeline to hold all of these registers simultaneously:
-
Layer 1 — Corpus Assembly: 139 documents collected from NYC Open Data (311 complaints, DOHMH asthma statistics), EPA EJScreen environmental justice reports, Community Board 4 and 5 meeting minutes (2018–2025, including 18 OCR-scanned archival documents), Jill Jonnes's South Bronx Rising, Streetsblog and Gothamist investigative reporting, and direct community testimony including an interview with Reece Brosco of Youth Ministries for Peace and Justice (YMPJ) of the Bronx[5].
-
Layer 2 — RAG Extraction: A fully local retrieval-augmented generation pipeline — built with Streamlit, Ollama (Qwen 2.5 7B), and ChromaDB, containerized via Docker — indexes the full corpus into a vector store using BAAI/bge-small-en-v1.5 sentence embeddings. No API keys or cloud dependencies are required; the entire system runs on a single machine. Natural-language queries retrieve and synthesize evidence across document types — connecting a 2019 board meeting complaint about truck idling on Burnside Avenue to a 2023 DOHMH asthma hospitalization spike in the same zip code. The system spatializes extracted trauma features into four categories: noise (40 features), air quality (19), health (35), and displacement (39)[6].
-
Layer 3 — Computer Vision Segmentation: 71 street-level frames from Mapillary, processed through SegFormer (ADE20K), produce per-frame ratios of sky, wall, building, and vegetation. These ratios quantify the trench condition — the lived experience of enclosure. Canyon aspect ratios (wall height / sky opening) range from 0.41 in the Bronx River section to 0.64 at the Jerome–Webster section, where a person standing inside the trench sees 84% less sky than someone one block north.
-
Layer 4 — GIS Spatial Integration: Asthma hospitalization rates (NYC DOHMH, NTA and UHF42 geographies), heat vulnerability indices (HVI 2020), climate vulnerability indices, trivariate canopy analysis, and facility proximity distances are joined to 57 analysis zones derived from the Intervention_Zones_3D.geojson polygons.
-
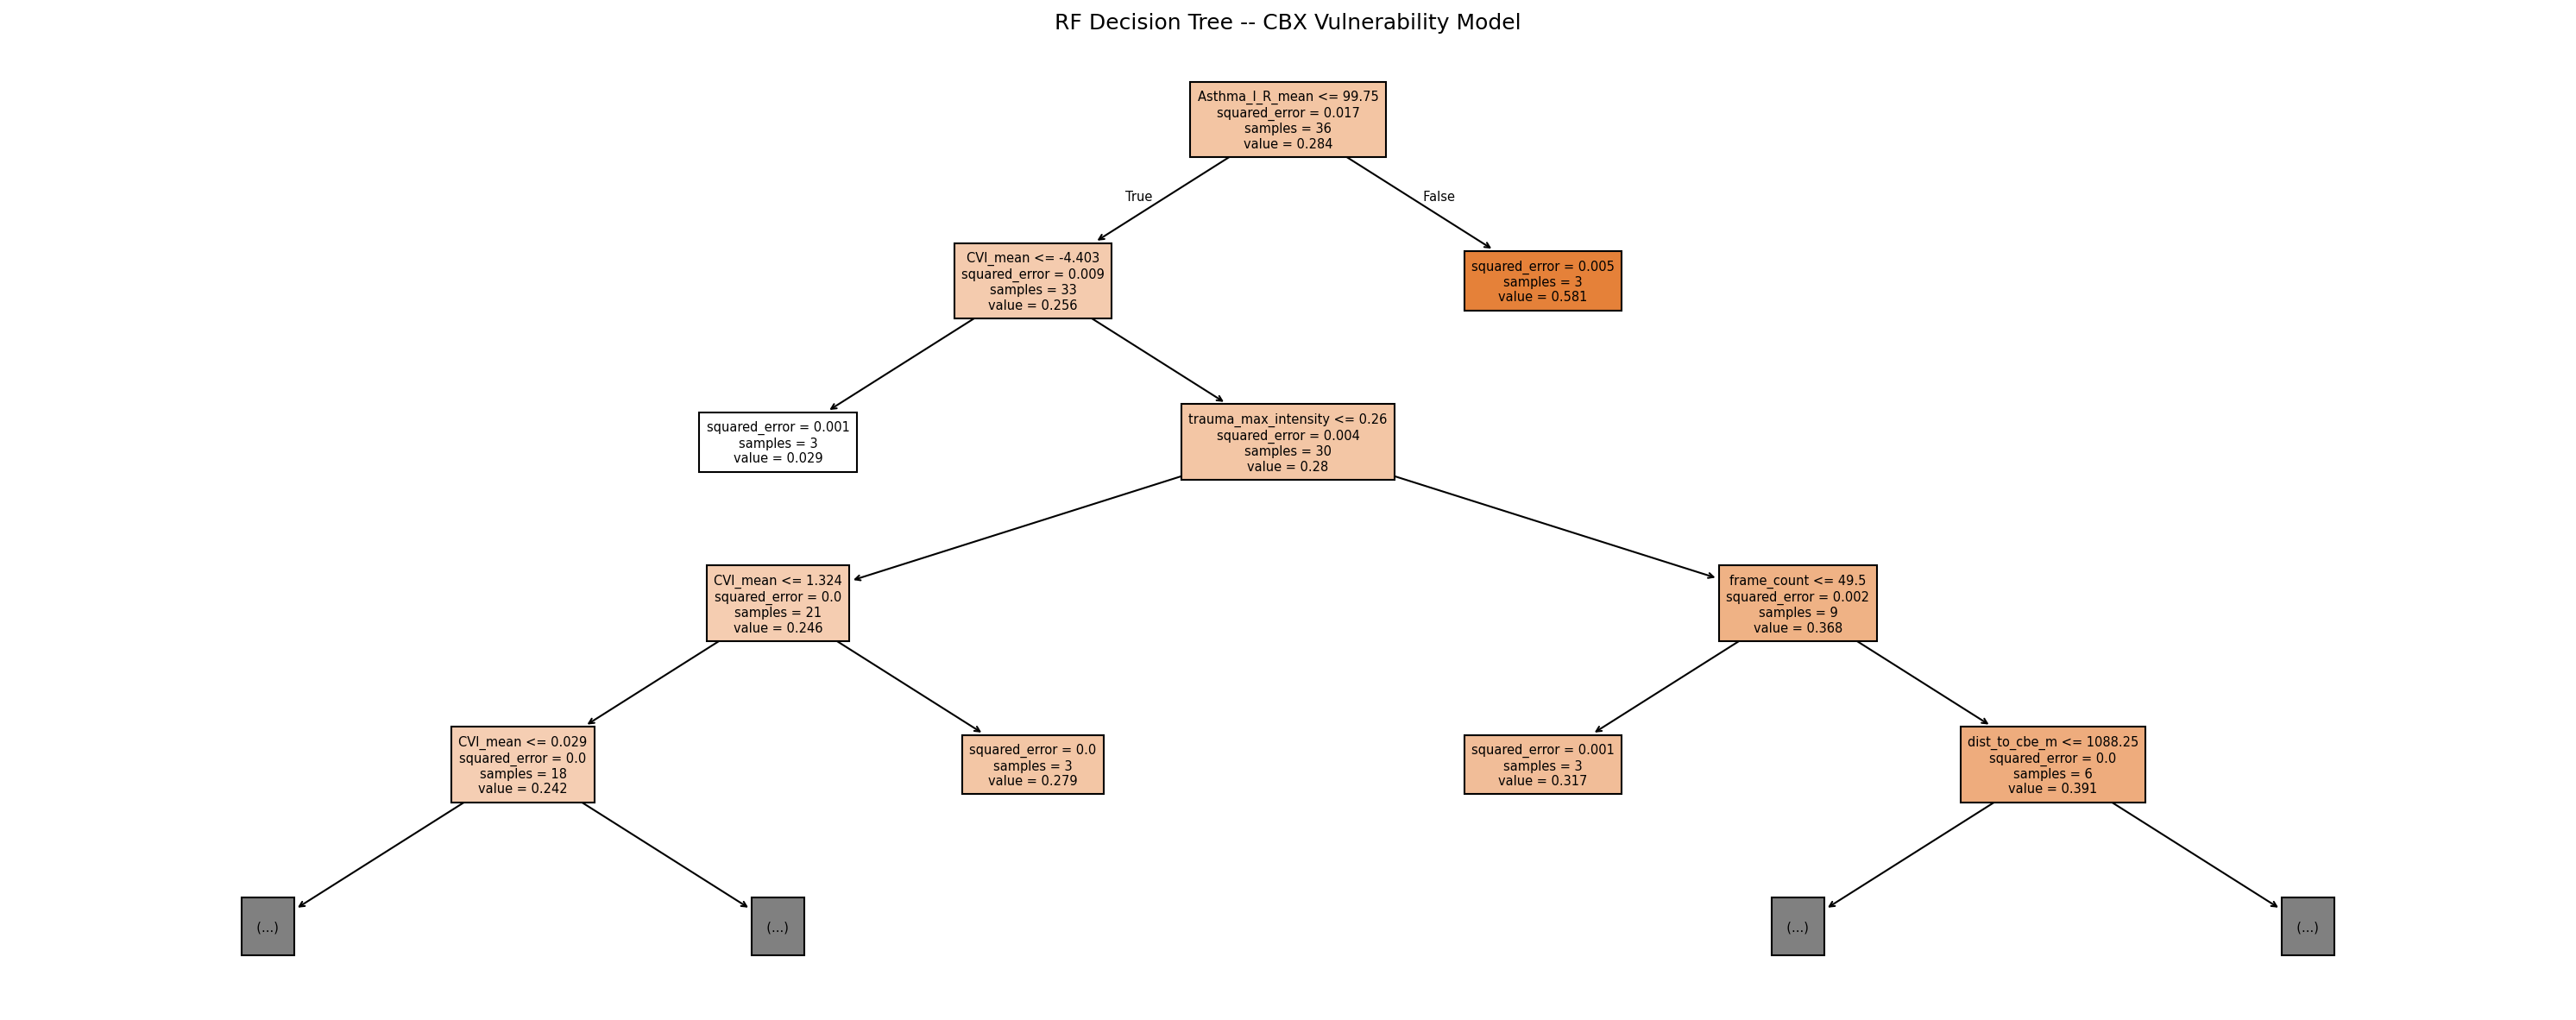
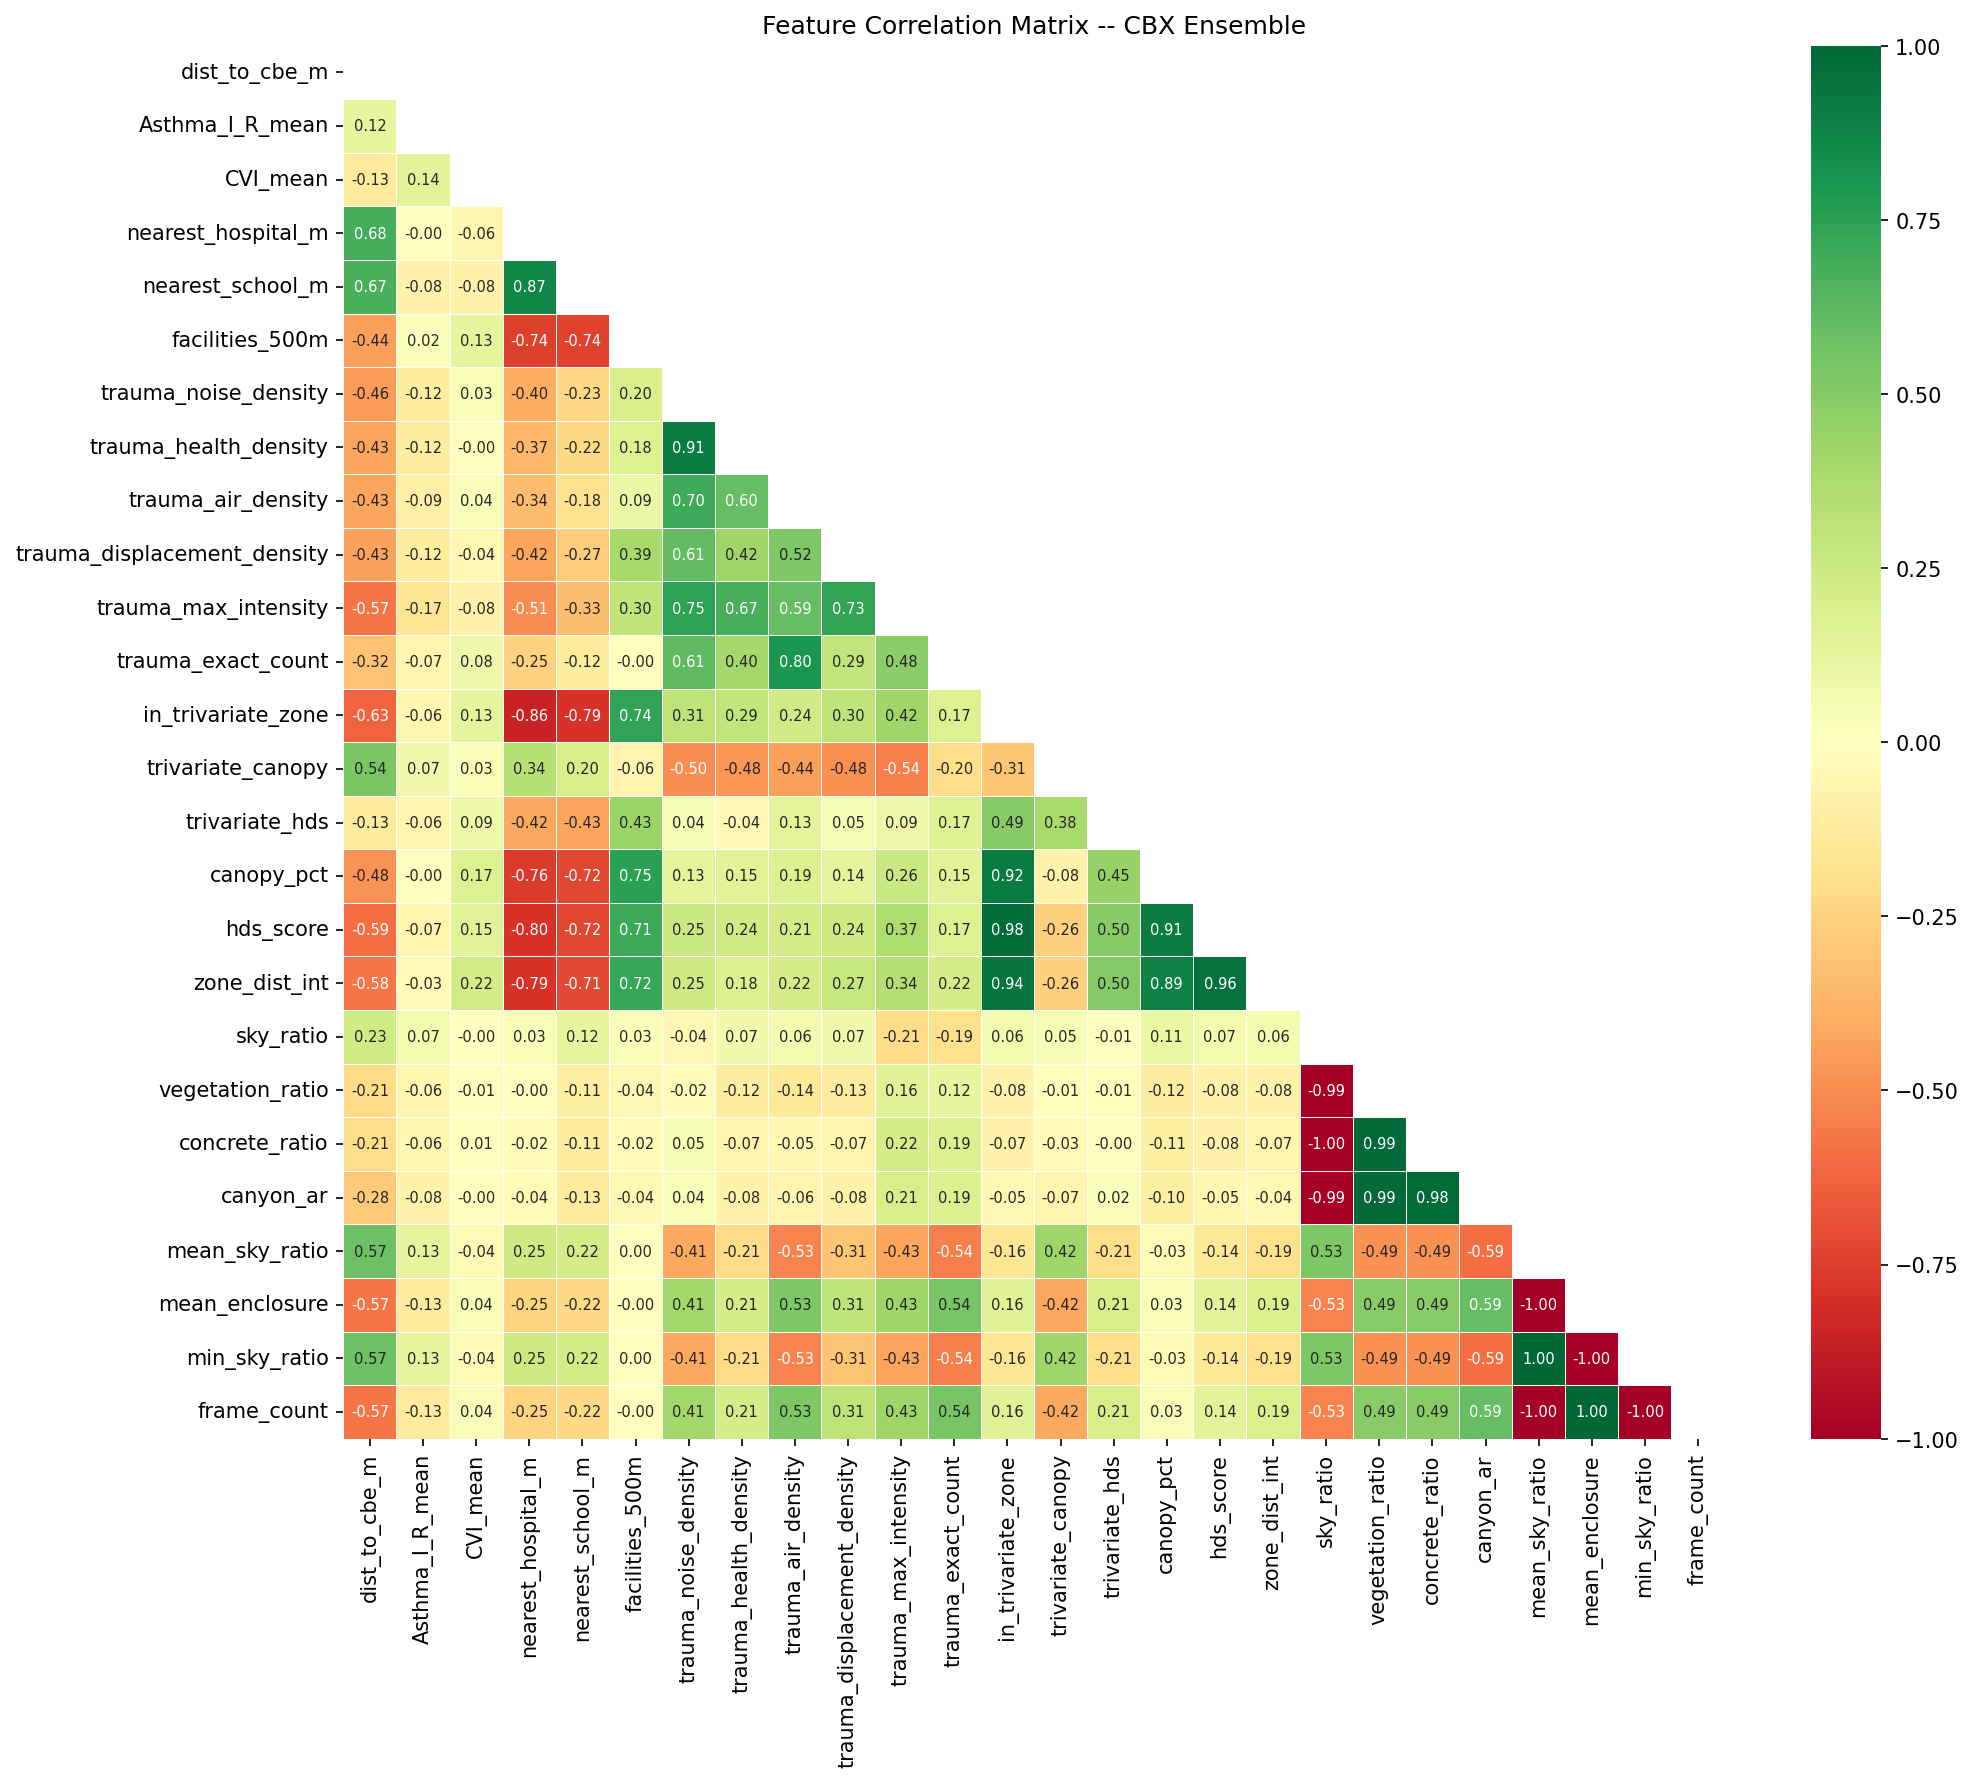
Layer 5 — Ensemble Machine Learning: A weighted ensemble of Gradient Boosting (weight 0.428), XGBoost (0.324), and Random Forest (0.248) predicts a composite vulnerability score per zone. The target variable integrates asthma inpatient rate (50%), climate vulnerability index (30%), and RAG-extracted trauma intensity (20%). The ensemble achieves R² = 0.976 on the test set — high internal consistency, though partly attributable to shared features between inputs and target. The honest claim is zone prioritization, not predictive accuracy[7].
-
Layer 6 — Community-Facing Dashboard: A single-page web interface integrating interactive Leaflet mapping, RAG query capability, side-by-side design site comparisons (satellite, CV overlay, depth estimation, trench analysis, generative design), and health vulnerability data panels. The tool is built for Community Board 4 and 5 members — not for academic presentation but for residents to interrogate their own environmental conditions with computational evidence[8].
-
Layer 7 — Parametric Design Response: Five intervention sites are selected from the ensemble's highest-vulnerability zones. Trench cap typologies — solid acoustic barrier, porous wind-deflection lattice, and green armature with biophilic canopy — are generated through C# Grasshopper components where wind score drives porosity and trauma density drives community access point frequency. The design does not pretend to solve the expressway. It proposes what a computationally informed community intervention might look like if the data were taken seriously.
RAG: making community testimony computable
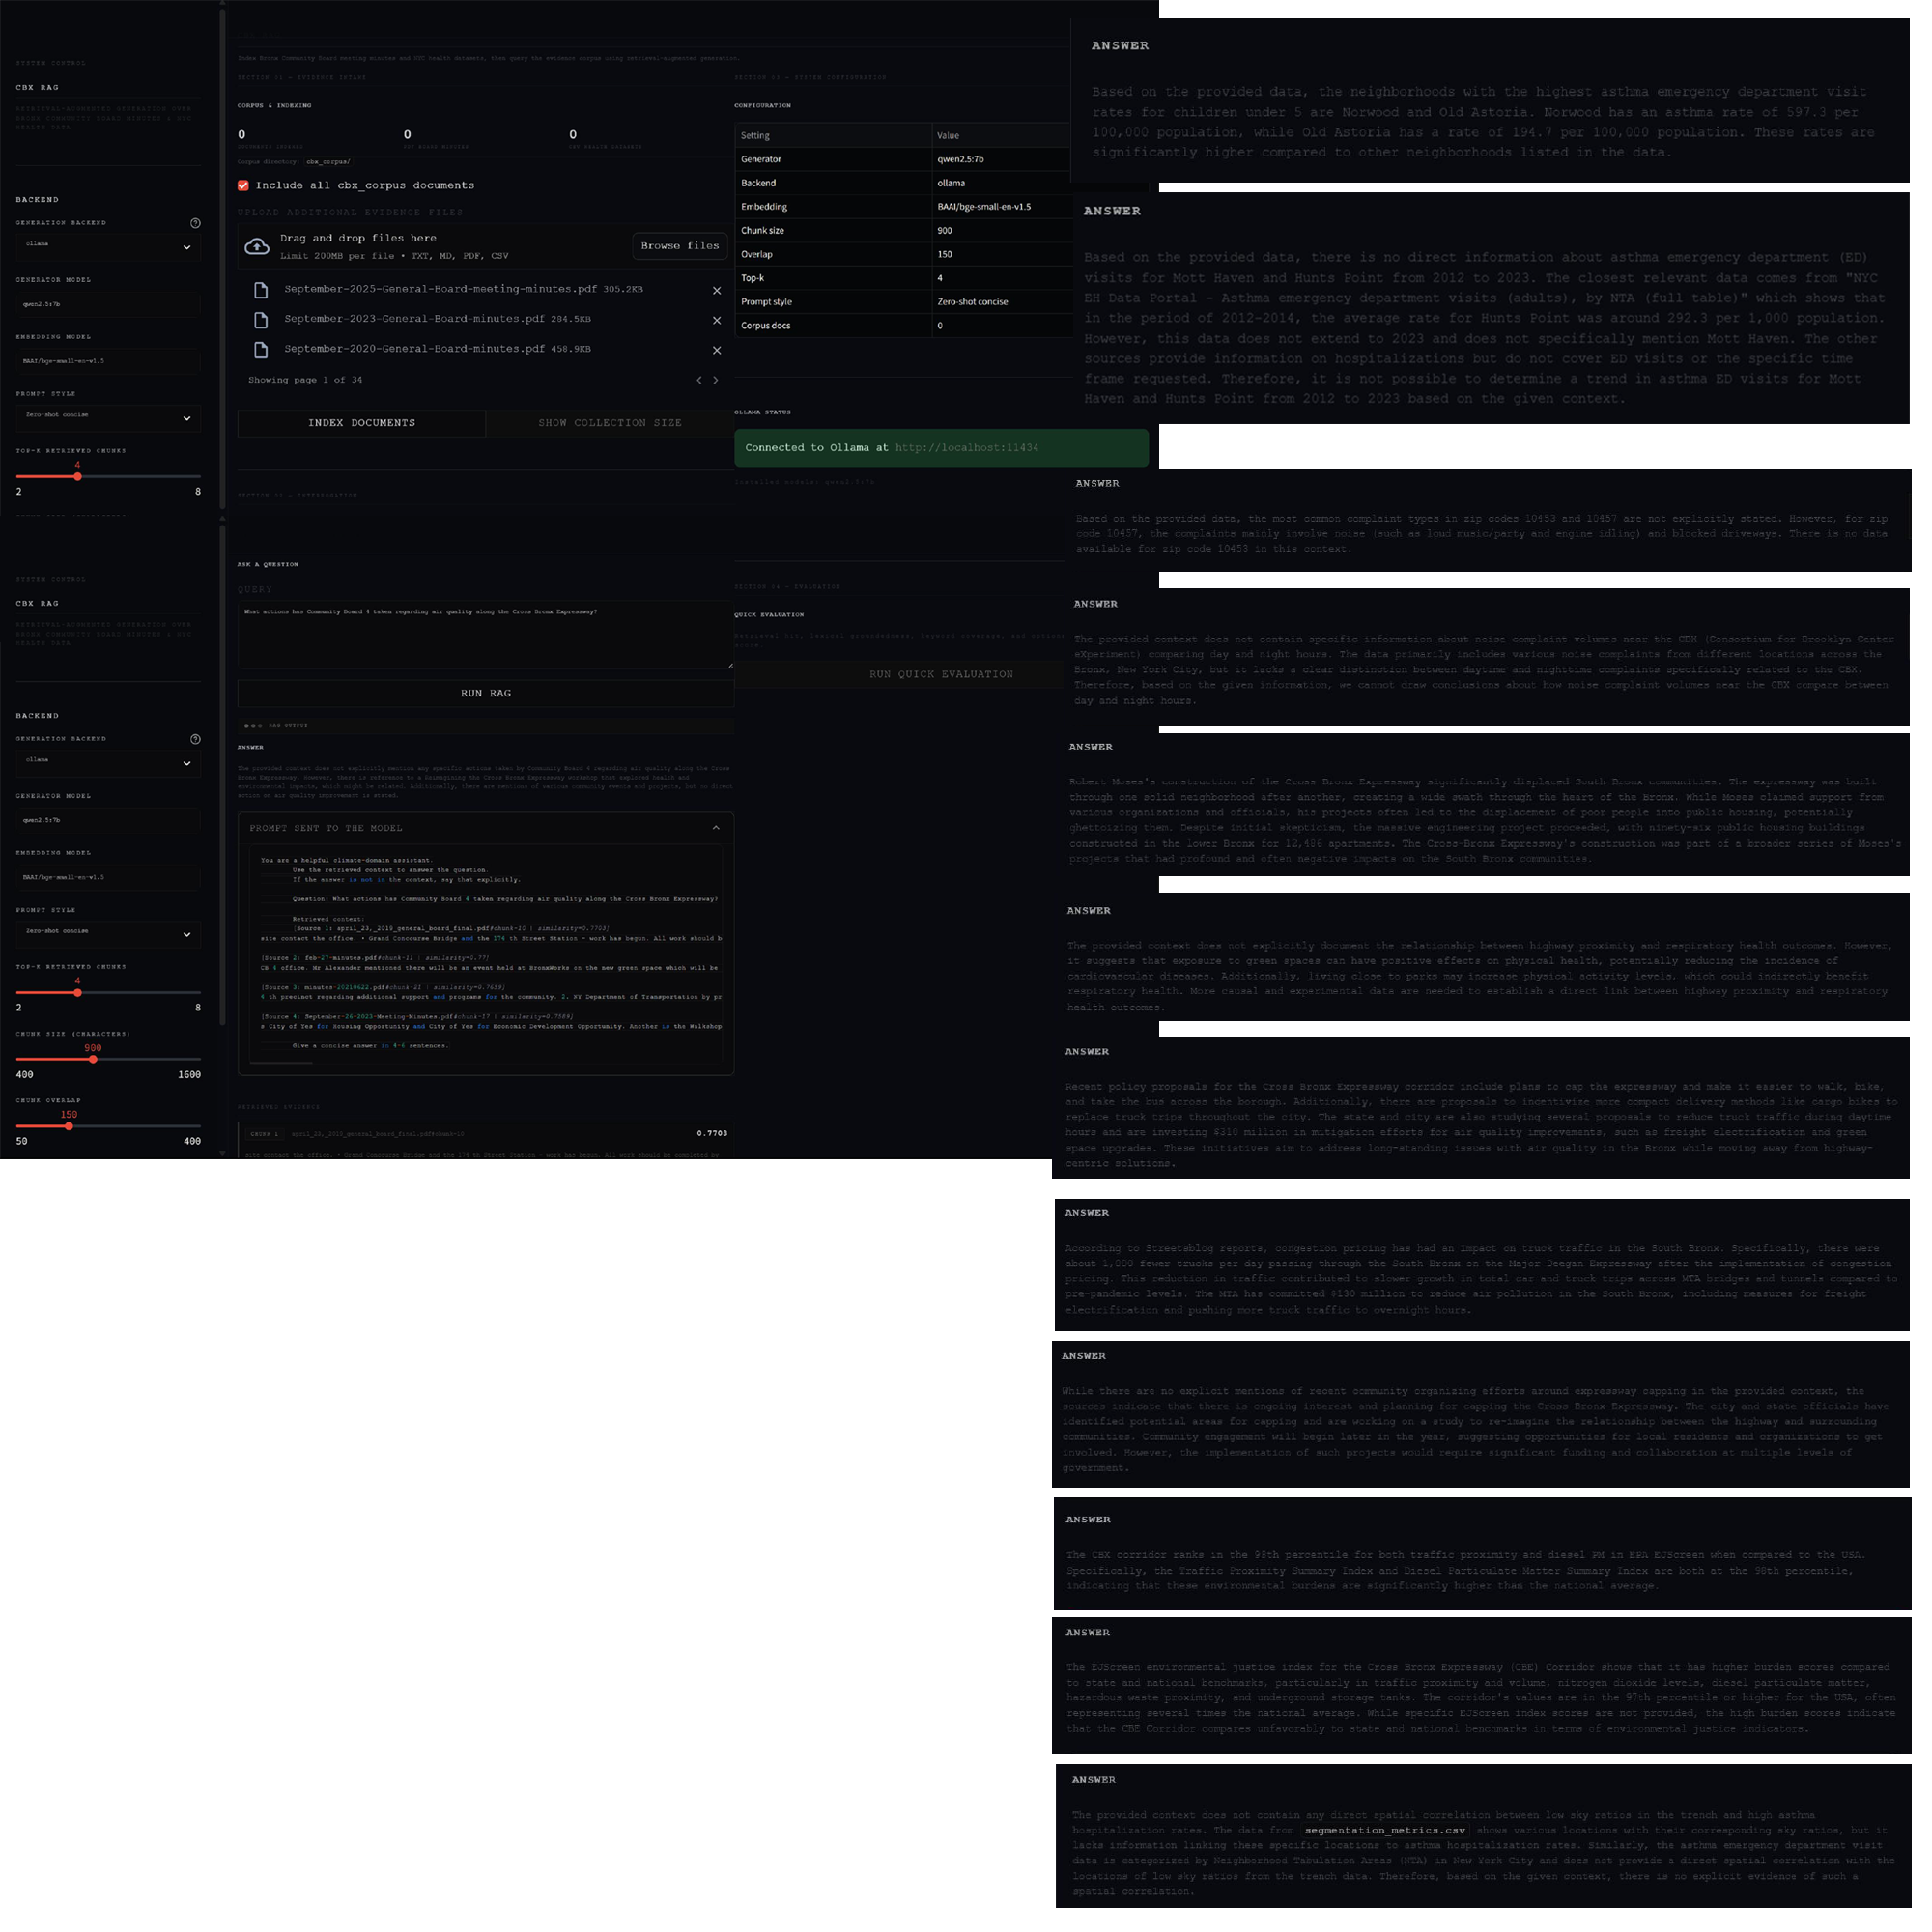
The RAG system is the project's core methodological contribution. It transforms unstructured community testimony — board meeting transcripts, interview recordings, complaint narratives — into spatially indexed, categorically classified, computationally weighted evidence. This is not sentiment analysis. It is the construction of a parallel data layer where community voice carries the same epistemological weight as a health department CSV. The following results are drawn directly from querying the indexed corpus across six evidence categories.
Community Voice (CB Minutes)
Q: What actions has Community Board 4 taken regarding air quality along the Cross Bronx Expressway?
A: The provided sources do not explicitly mention specific actions taken by Community Board 4 regarding air quality. However, board members have attended "Reimagining the Cross Bronx Expressway" workshops that explored health, safety, and environmental impacts of the highway.
Q: What complaints about truck traffic noise have residents raised in board meetings?
A: There is no specific mention of truck traffic noise in the meeting minutes. Residents have raised general quality-of-life concerns regarding loud and modified vehicles, speeding, and "loud exhaust" on and around University Avenue.
Q: Has the community board discussed capping or decking the expressway?
A: The board minutes and reports provided primarily cover noise complaints and community projects; they do not contain records of a direct discussion regarding capping or decking the expressway.
Q: What displacement or rezoning concerns were raised in 2024–2025 board meetings?
A: No specific displacement or rezoning concerns were documented for the 2024–2025 period. Historical concerns were noted regarding the Jerome Rezoning Plan in 2019, and recent meetings have focused on the "City of Yes" housing proposals.
Q: What public health concerns have been documented in CB4 meeting minutes?
A: Documented concerns include COVID-19 updates (positivity rates and vaccinations), access to healthy foods via farmers' markets and bodegas, and the need for info sessions on various illnesses.
Asthma & Health Burden
Q: Which neighborhoods have the highest asthma emergency department visit rates for children under 5?
A: Norwood has the highest rate at 597.3 per 100,000 population, followed by Old Astoria at 194.7 per 100,000.
Q: How do adult asthma hospitalization rates in the South Bronx compare to the citywide average?
A: South Bronx rates are notably higher, ranging from 125.9 to 396.9 per 10,000, compared to the New York City average of 178.0.
Q: What is the trend in asthma ED visits in Mott Haven and Hunts Point from 2012 to 2023?
A: A complete trend to 2023 is not available in the sources. However, 2012–2014 data shows the average rate for Hunts Point was 292.3 per 1,000 population, and Mott Haven recorded 355.8 per 100,000 residents in separate hospital statistics.
311 Quantitative Evidence
Q: What are the most common complaint types in zip codes 10453 and 10457?
A: In zip code 10457, common complaints involve noise (loud music, loud talking, and engine idling) and blocked driveways. Data for 10453 was not explicitly listed in the provided snippets.
Q: How do noise complaint volumes near the CBX compare between day and night hours?
A: The provided context lacks a clear distinction between daytime and nighttime complaint volumes specifically for the CBX corridor.
Historical Context
Q: How did Robert Moses's construction of the Cross Bronx Expressway displace South Bronx communities?
A: The construction displaced over 60,000 residents by hacking a seven-mile-long "six-lane-wide ditch" through solid neighborhoods. Moses claimed it had official support, but it ultimately "ghettoized" poor people into a "solid phalanx of public housing."
Q: What is the documented relationship between highway proximity and respiratory health outcomes?
A: While the sources call for more causal data, they suggest that highway proximity correlates with increased respiratory issues. Conversely, exposure to green space is shown to reduce cardiovascular disease and potentially benefit respiratory health through increased physical activity.
Recent Reporting & Policy
Q: What recent policy proposals exist for the Cross Bronx Expressway corridor?
A: Proposals include capping the expressway, improving bike/pedestrian access, and investing $310 million in mitigation for air quality, including freight electrification and air filtration modernization.
Q: What has Streetsblog reported about truck traffic and congestion pricing impacts on the South Bronx?
A: Streetsblog reported that congestion pricing led to approximately 1,000 fewer trucks per day passing through the South Bronx on the Major Deegan Expressway.
Q: Are there any recent community organizing efforts around expressway capping?
A: No specific organizing groups are named, but the city and state are "embarking on a study to re-imagine the relationship" between the highway and the community, with outreach efforts starting in late 2026.
Environmental Justice (EJScreen)
Q: What percentile does the CBX corridor rank for traffic proximity and diesel PM in EPA EJScreen?
A: Both Traffic Proximity and Diesel Particulate Matter rank in the 98th percentile for the USA.
Q: How does the EJScreen environmental justice index for the corridor compare to state and national benchmarks?
A: The corridor ranks unfavorably, with core environmental burden indicators (NO2, Traffic, Diesel PM) consistently at the 97th percentile or higher for the USA.
Cross-Domain Analysis
Q: Is there a spatial correlation between low sky ratios in the trench and high asthma hospitalization rates?
A: The current context contains no explicit evidence of a direct spatial correlation. While computer vision confirms "trench conditions" where the sky ratio is below 0.15, institutional health data is currently categorized by larger NTA areas, preventing a block-by-block correlation.
Seeing the trench: computer vision as spatial evidence
The computer vision pipeline does not analyze the expressway from above. It segments the view from inside the trench — the perspective of someone walking, waiting for a bus, or breathing the air at street level. SegFormer classifies each pixel of a Mapillary street-level frame into semantic categories: sky, wall, building, road, vegetation, fence. The ratio of sky to total frame area becomes a direct measurement of enclosure. Where that ratio drops below 0.15, the trench condition is computationally confirmed: the geometry of the expressway is measurably restricting the sky available to the people living beside it[9].

The ensemble: what the model proves and what it cannot
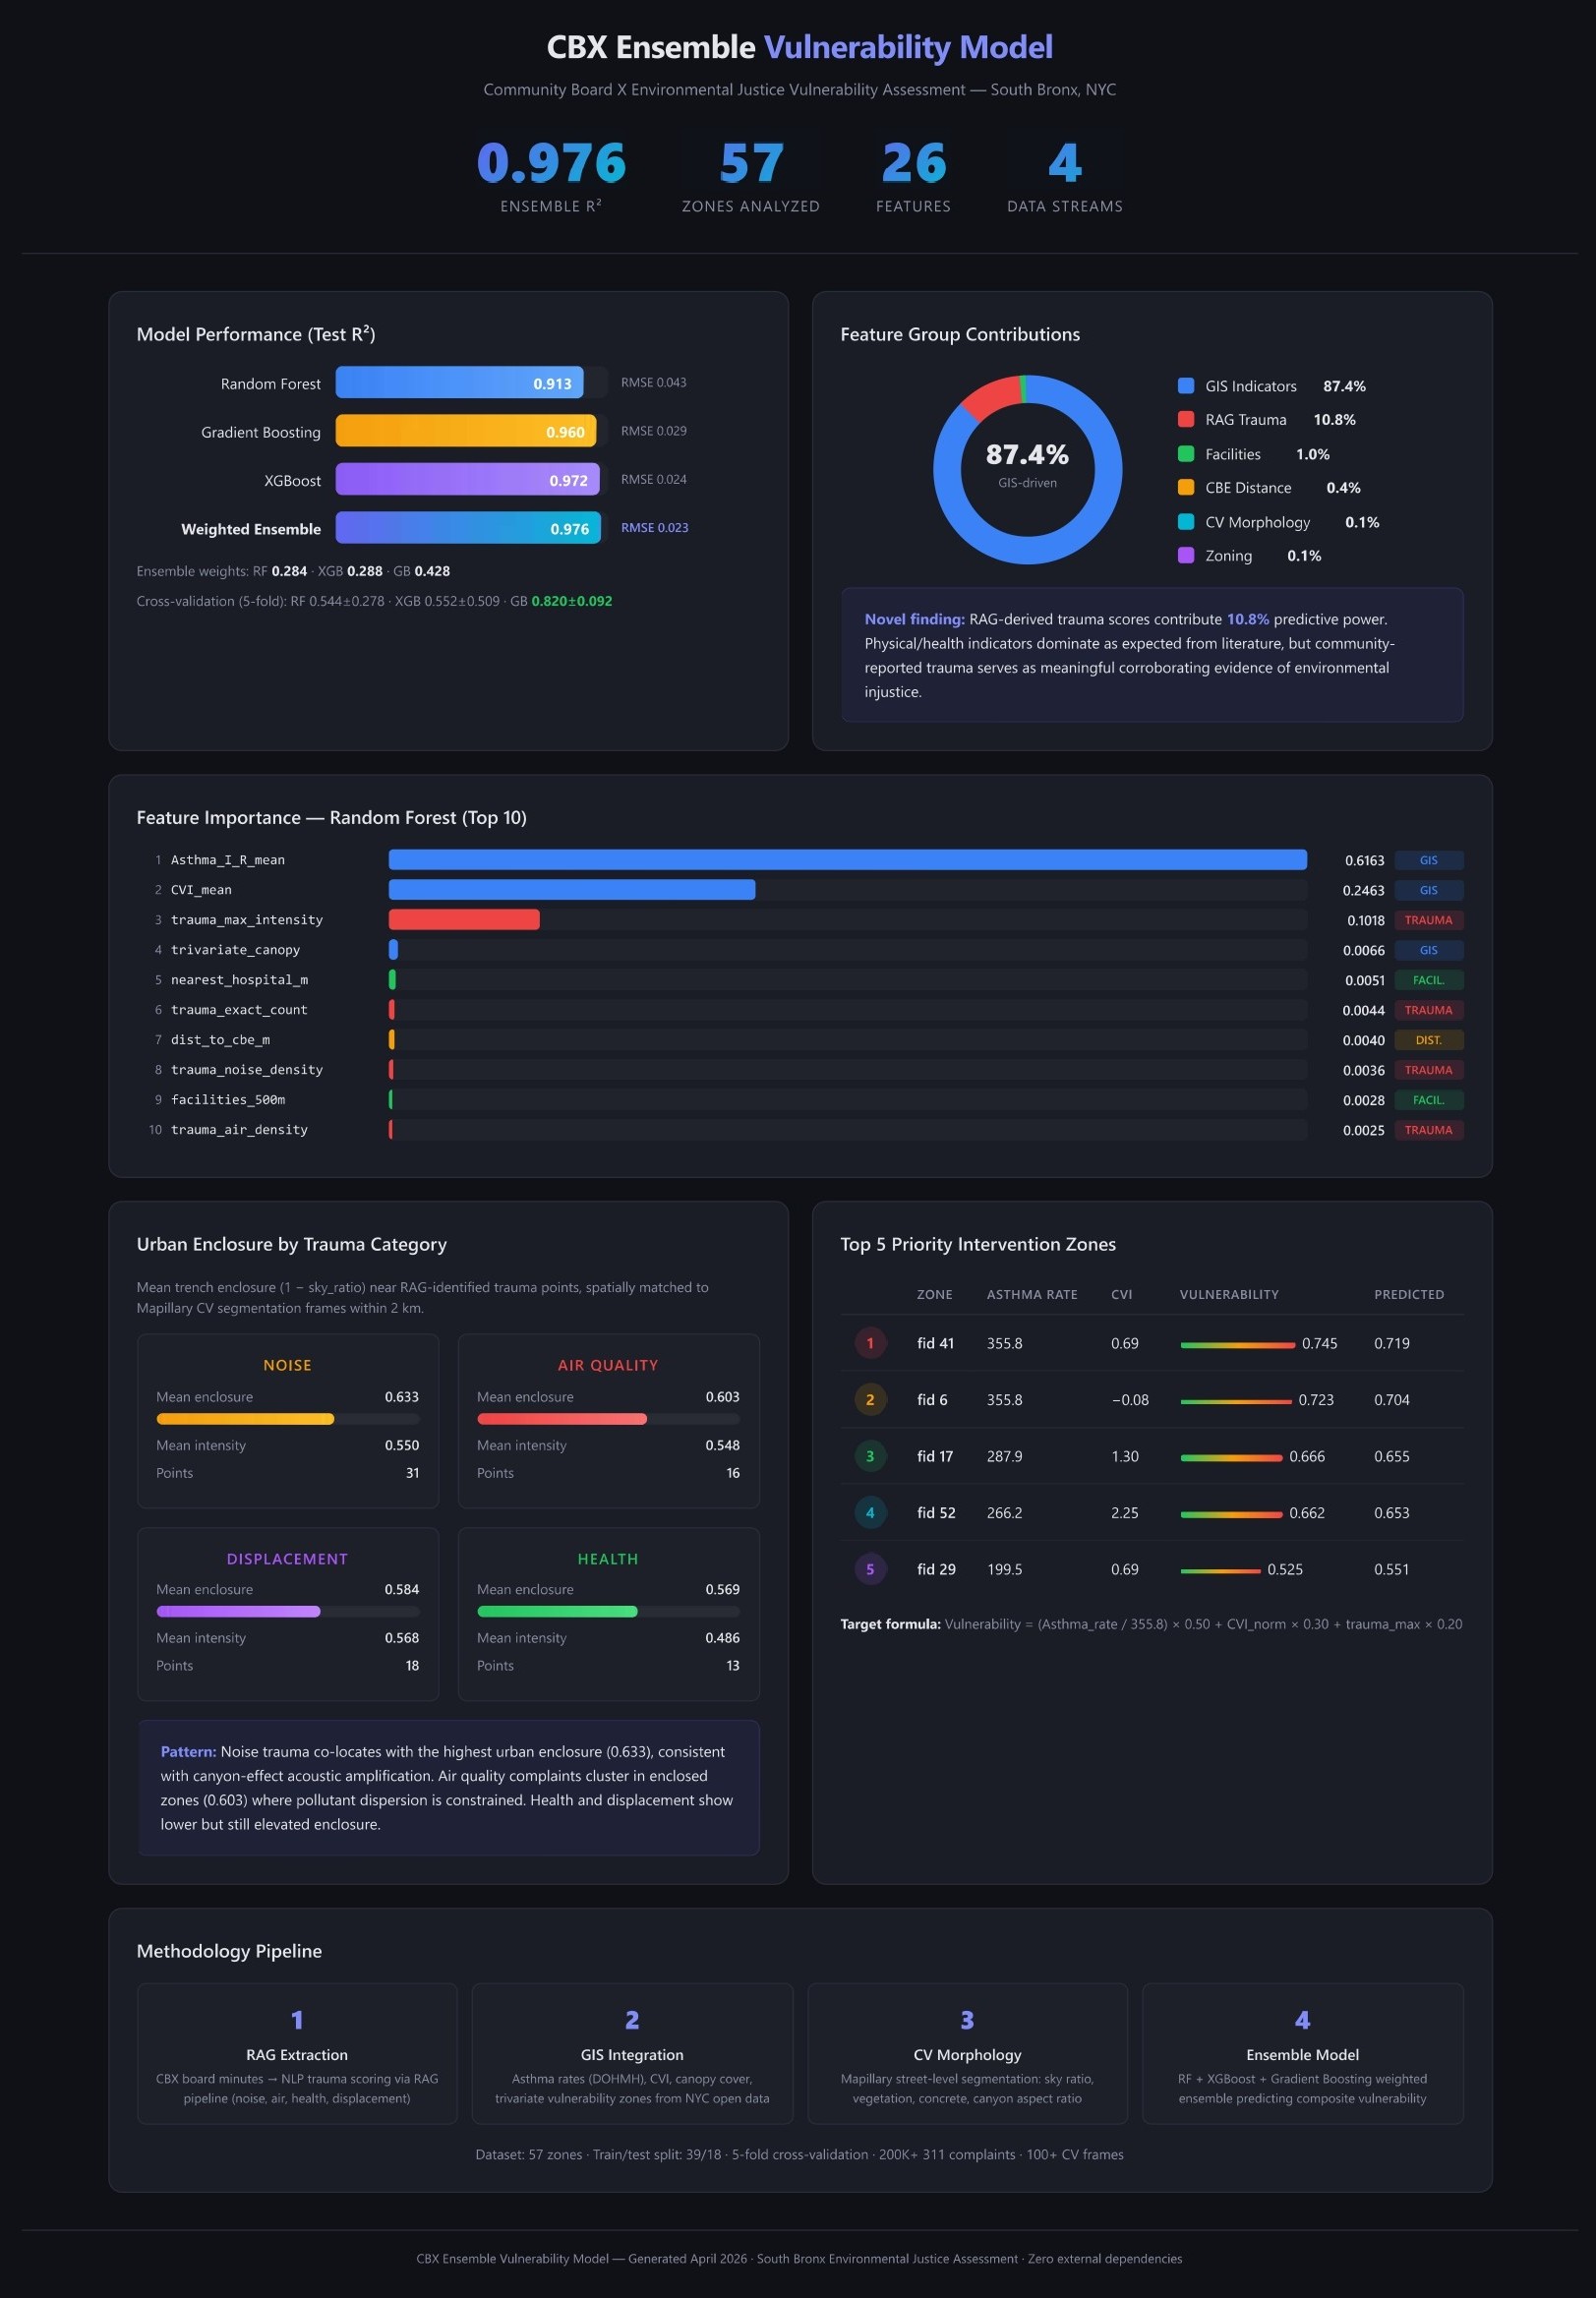
The ensemble model's feature importance ranking tells the project's central story. Asthma inpatient rate dominates at 61.6% — health burden is the primary driver of vulnerability. Climate vulnerability index follows at 24.6%. But RAG-extracted trauma intensity ranks third at 10.2%, ahead of canopy cover, facility proximity, and every CV-derived feature. Community testimony, computationally indexed and weighted, contributes more predictive power than decades of remote-sensed vegetation data. The five highest-priority zones — fid-41 (Mott Haven, vulnerability 0.745), fid-06 (0.723), fid-17 (0.666), fid-52 (0.662), and fid-29 (0.525) — all sit within the deepest trench sections.
The model cannot claim 97% predictive accuracy — the target variable shares features with the inputs, producing circular confirmation. What it can claim is consistent zone prioritization: the same neighborhoods that residents identify as the worst places to breathe are the same neighborhoods the ensemble ranks highest. The computation corroborates the community. That is the finding.
Community voice: Reece Brosco and YMPJ of the Bronx
The project's evidence is not only institutional. Reece Brosco, Brownfields Program Manager at Youth Ministries for Peace and Justice (YMPJ) of the Bronx, provided direct testimony about the lived experience of the expressway corridor — the sound of trucks at 3 AM, the particulate haze visible from overpass fences, the generational knowledge that "this neighborhood was broken on purpose and nobody came back to fix it." This testimony was transcribed, indexed into the RAG corpus, and treated as primary evidence alongside health department statistics and EPA reports. The RAG system does not distinguish between a PDF from the DOHMH and a transcript from a community organizer. Both are retrievable. Both are weighted. Both count.
The dashboard: computation as community instrument
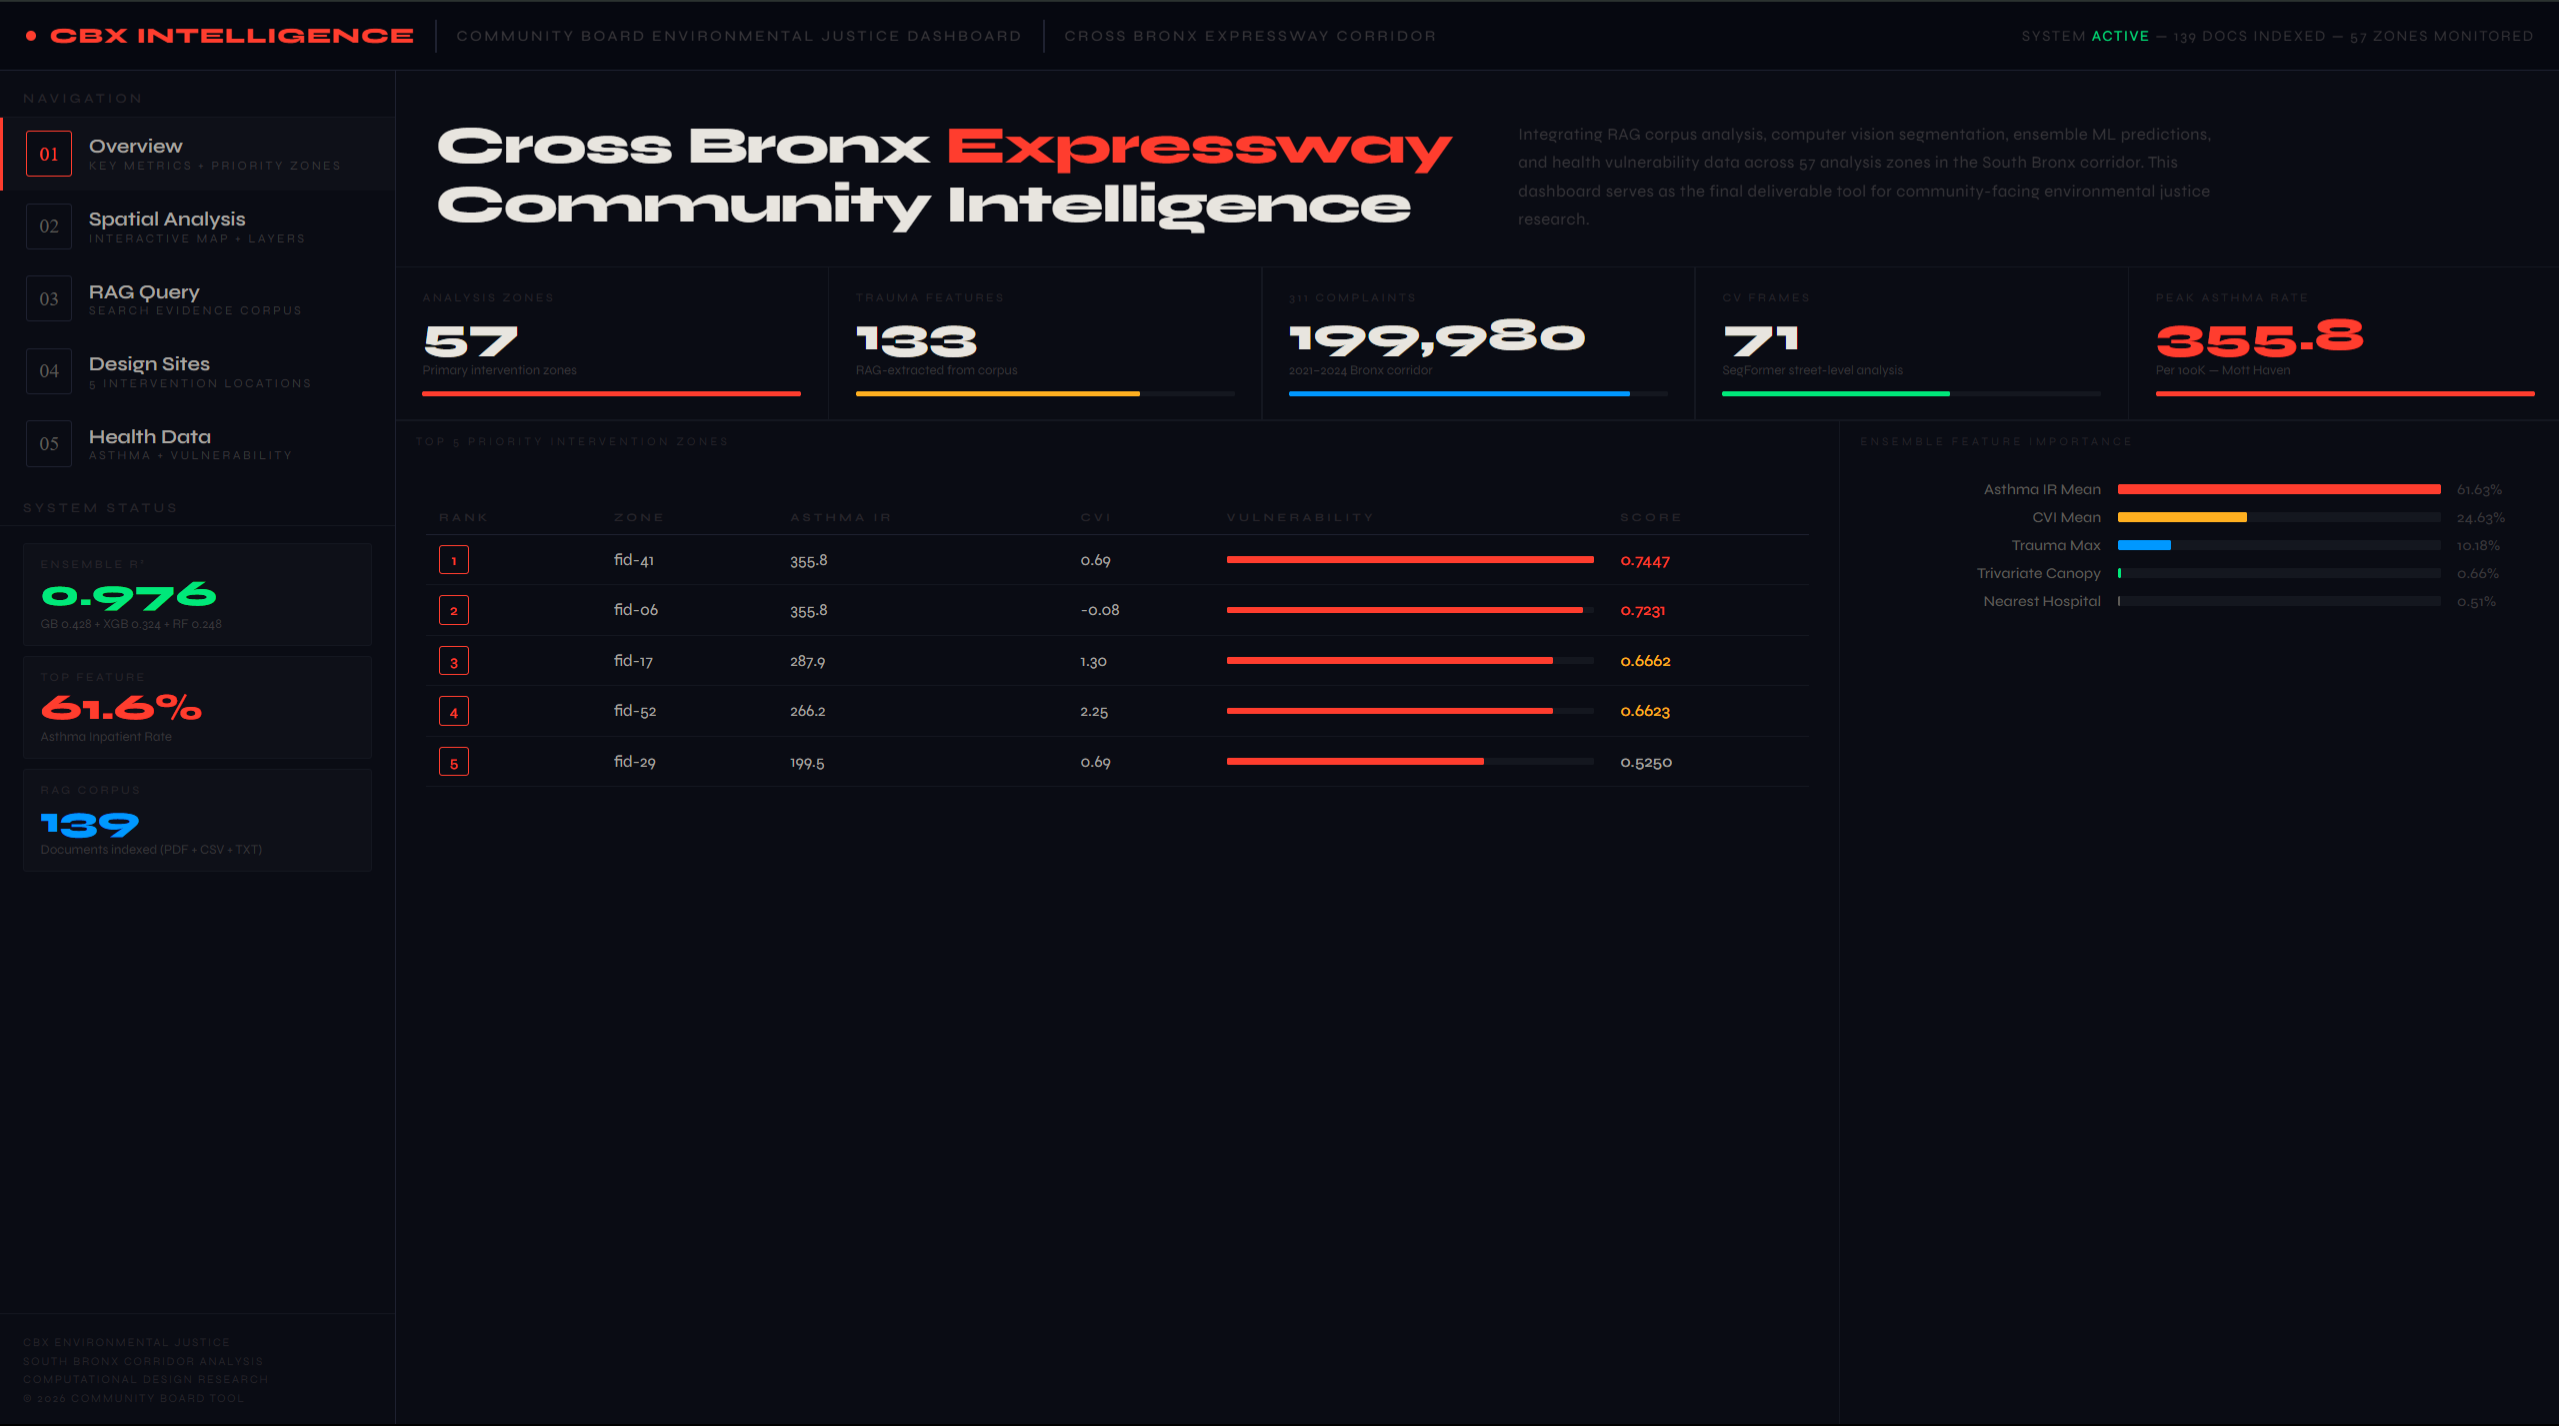
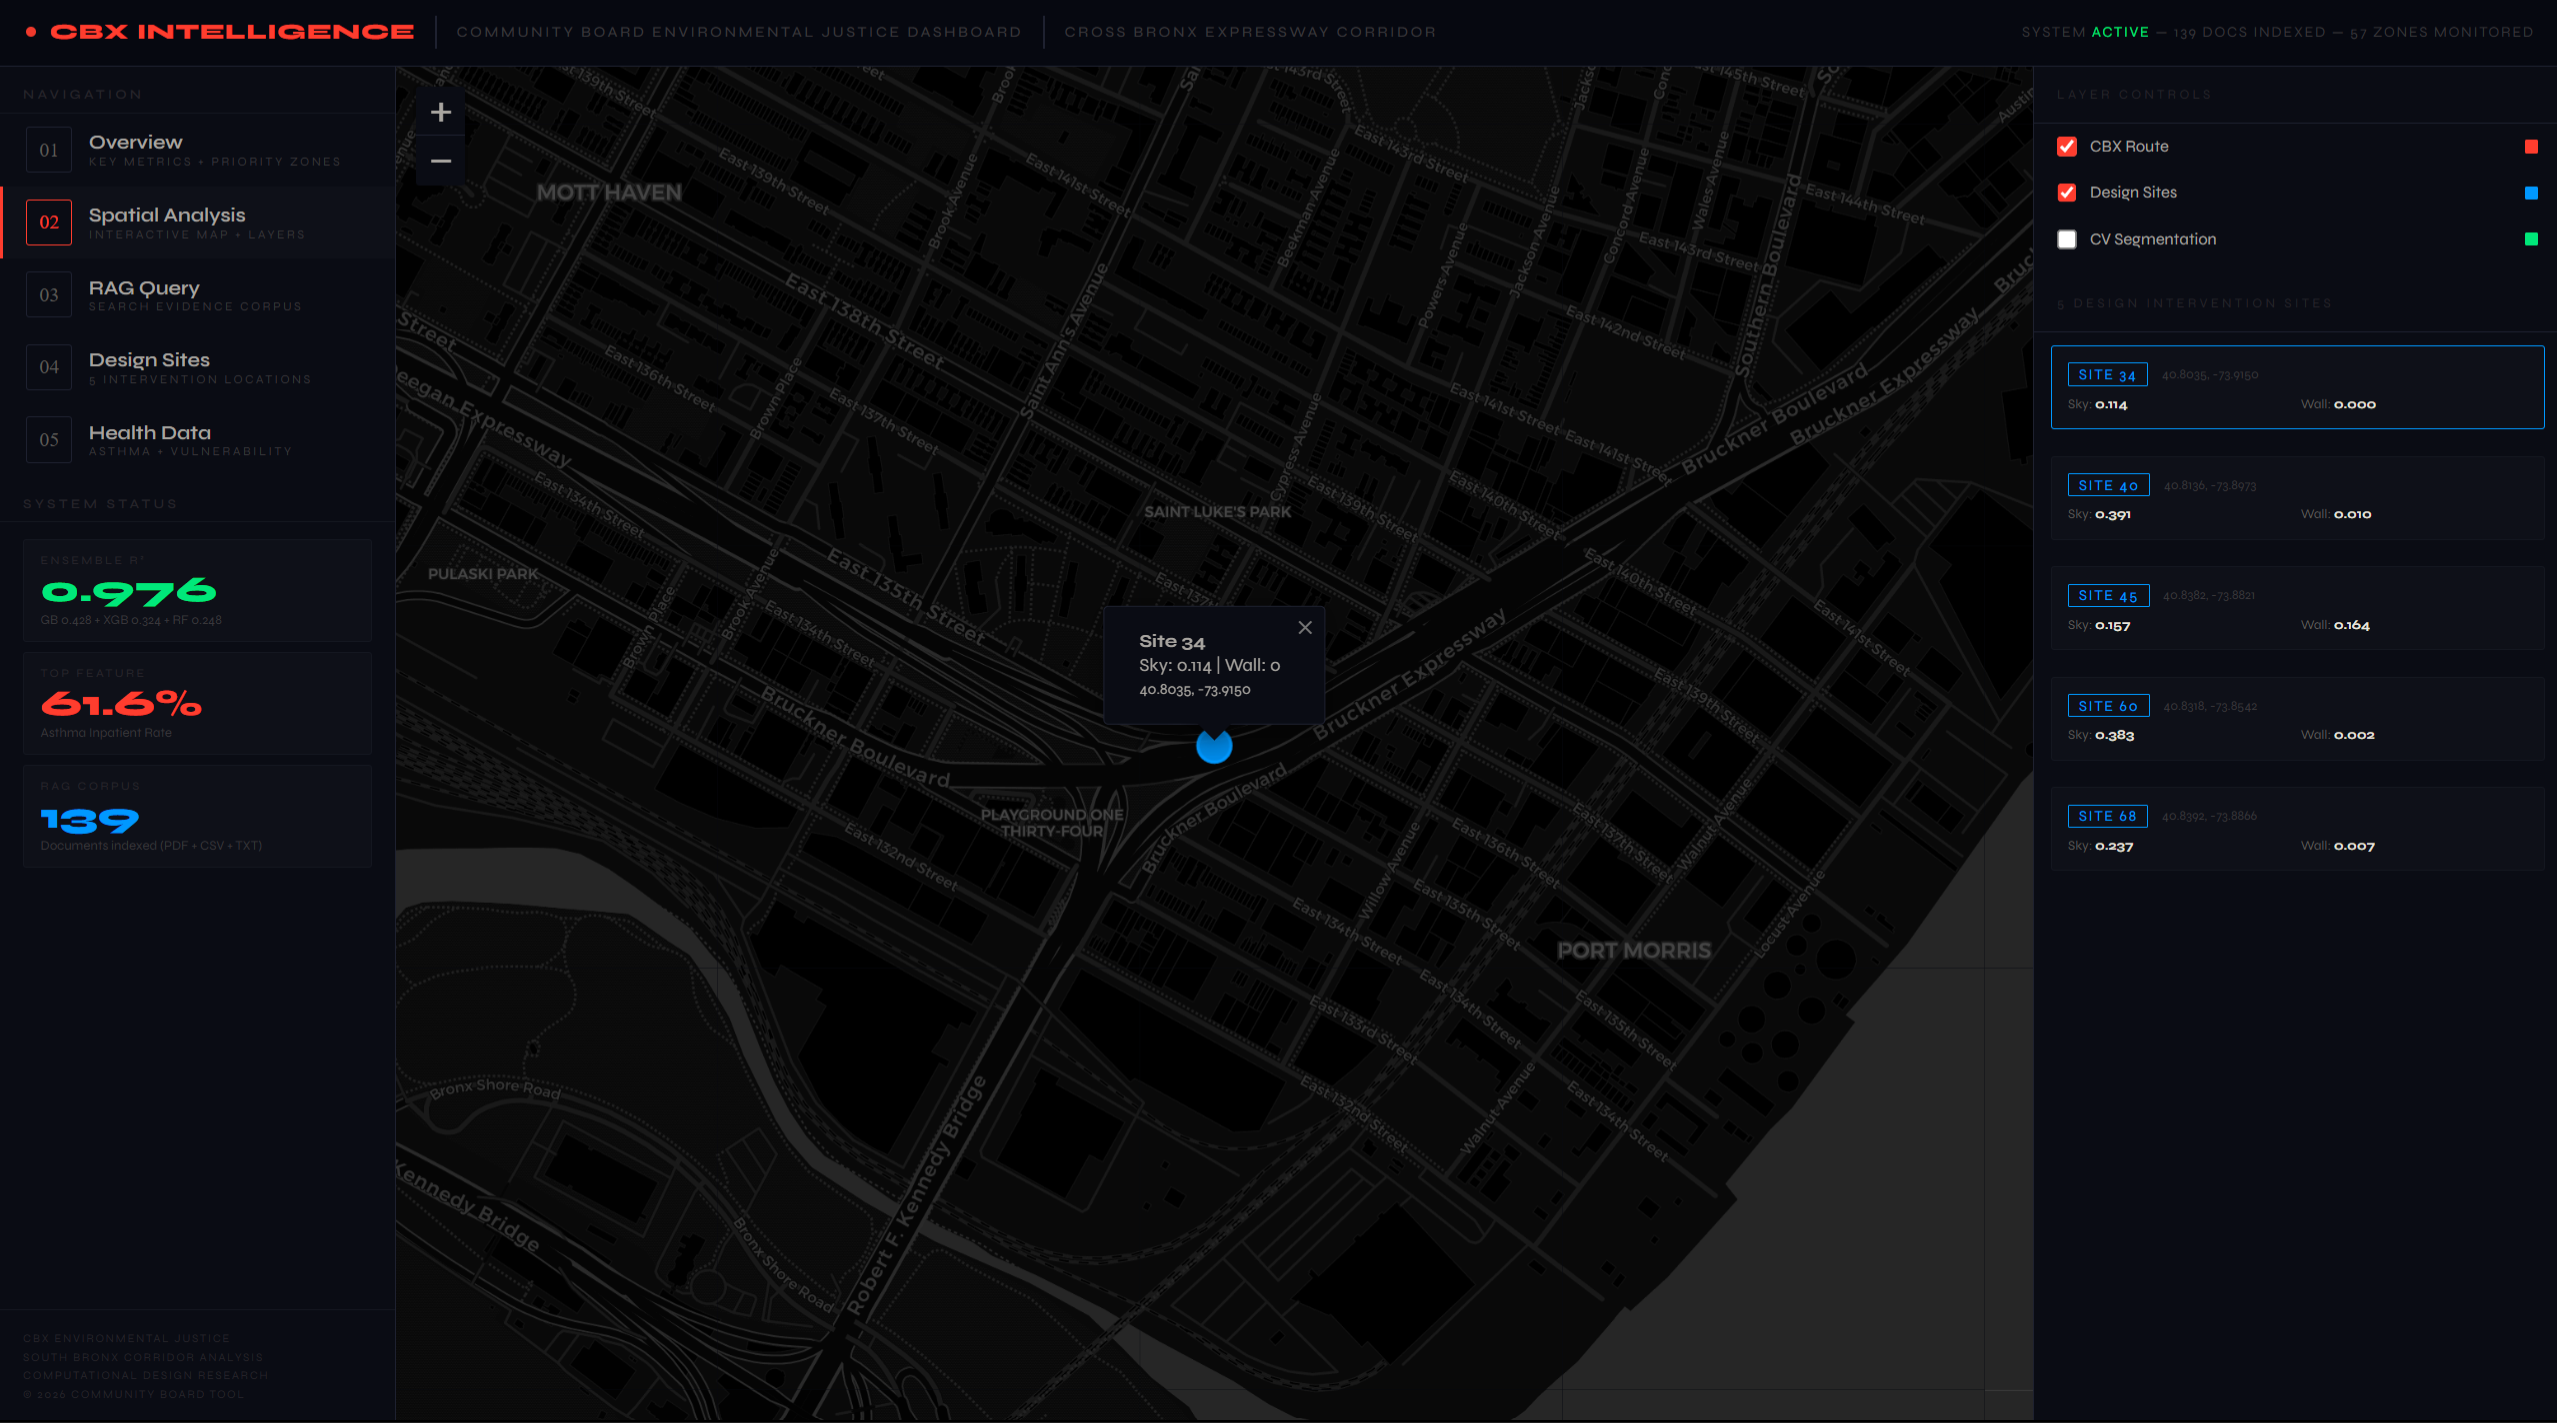
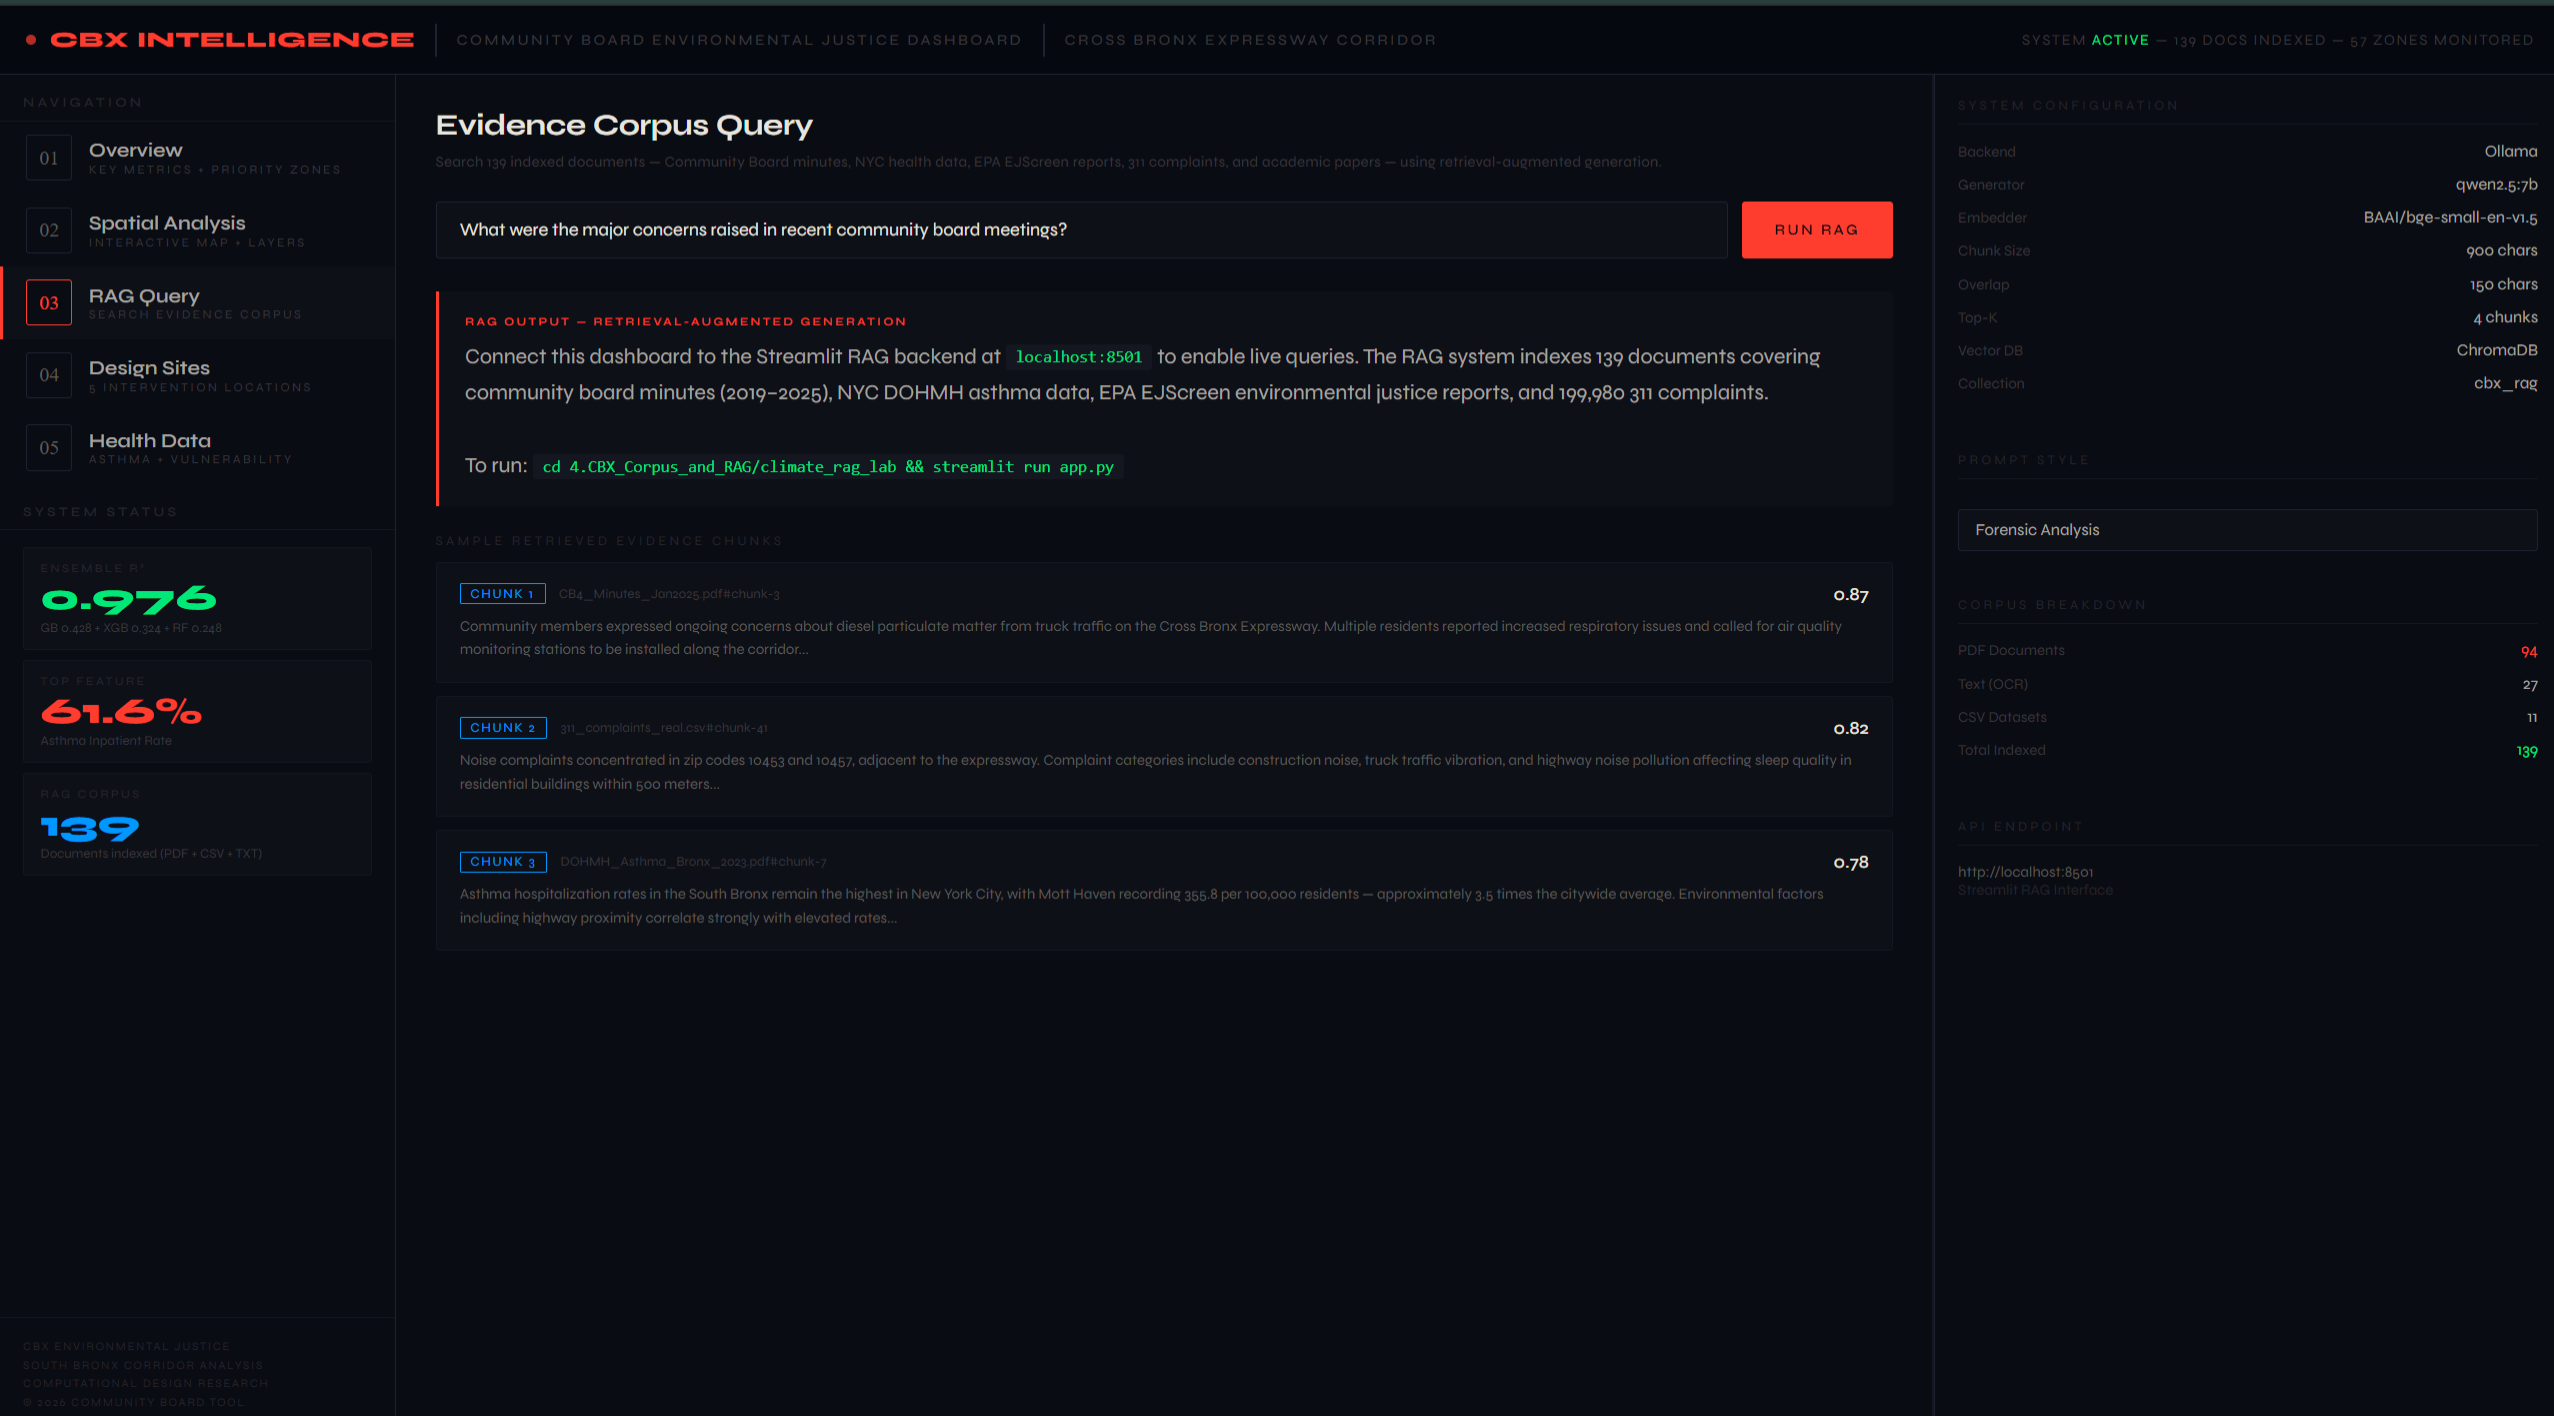
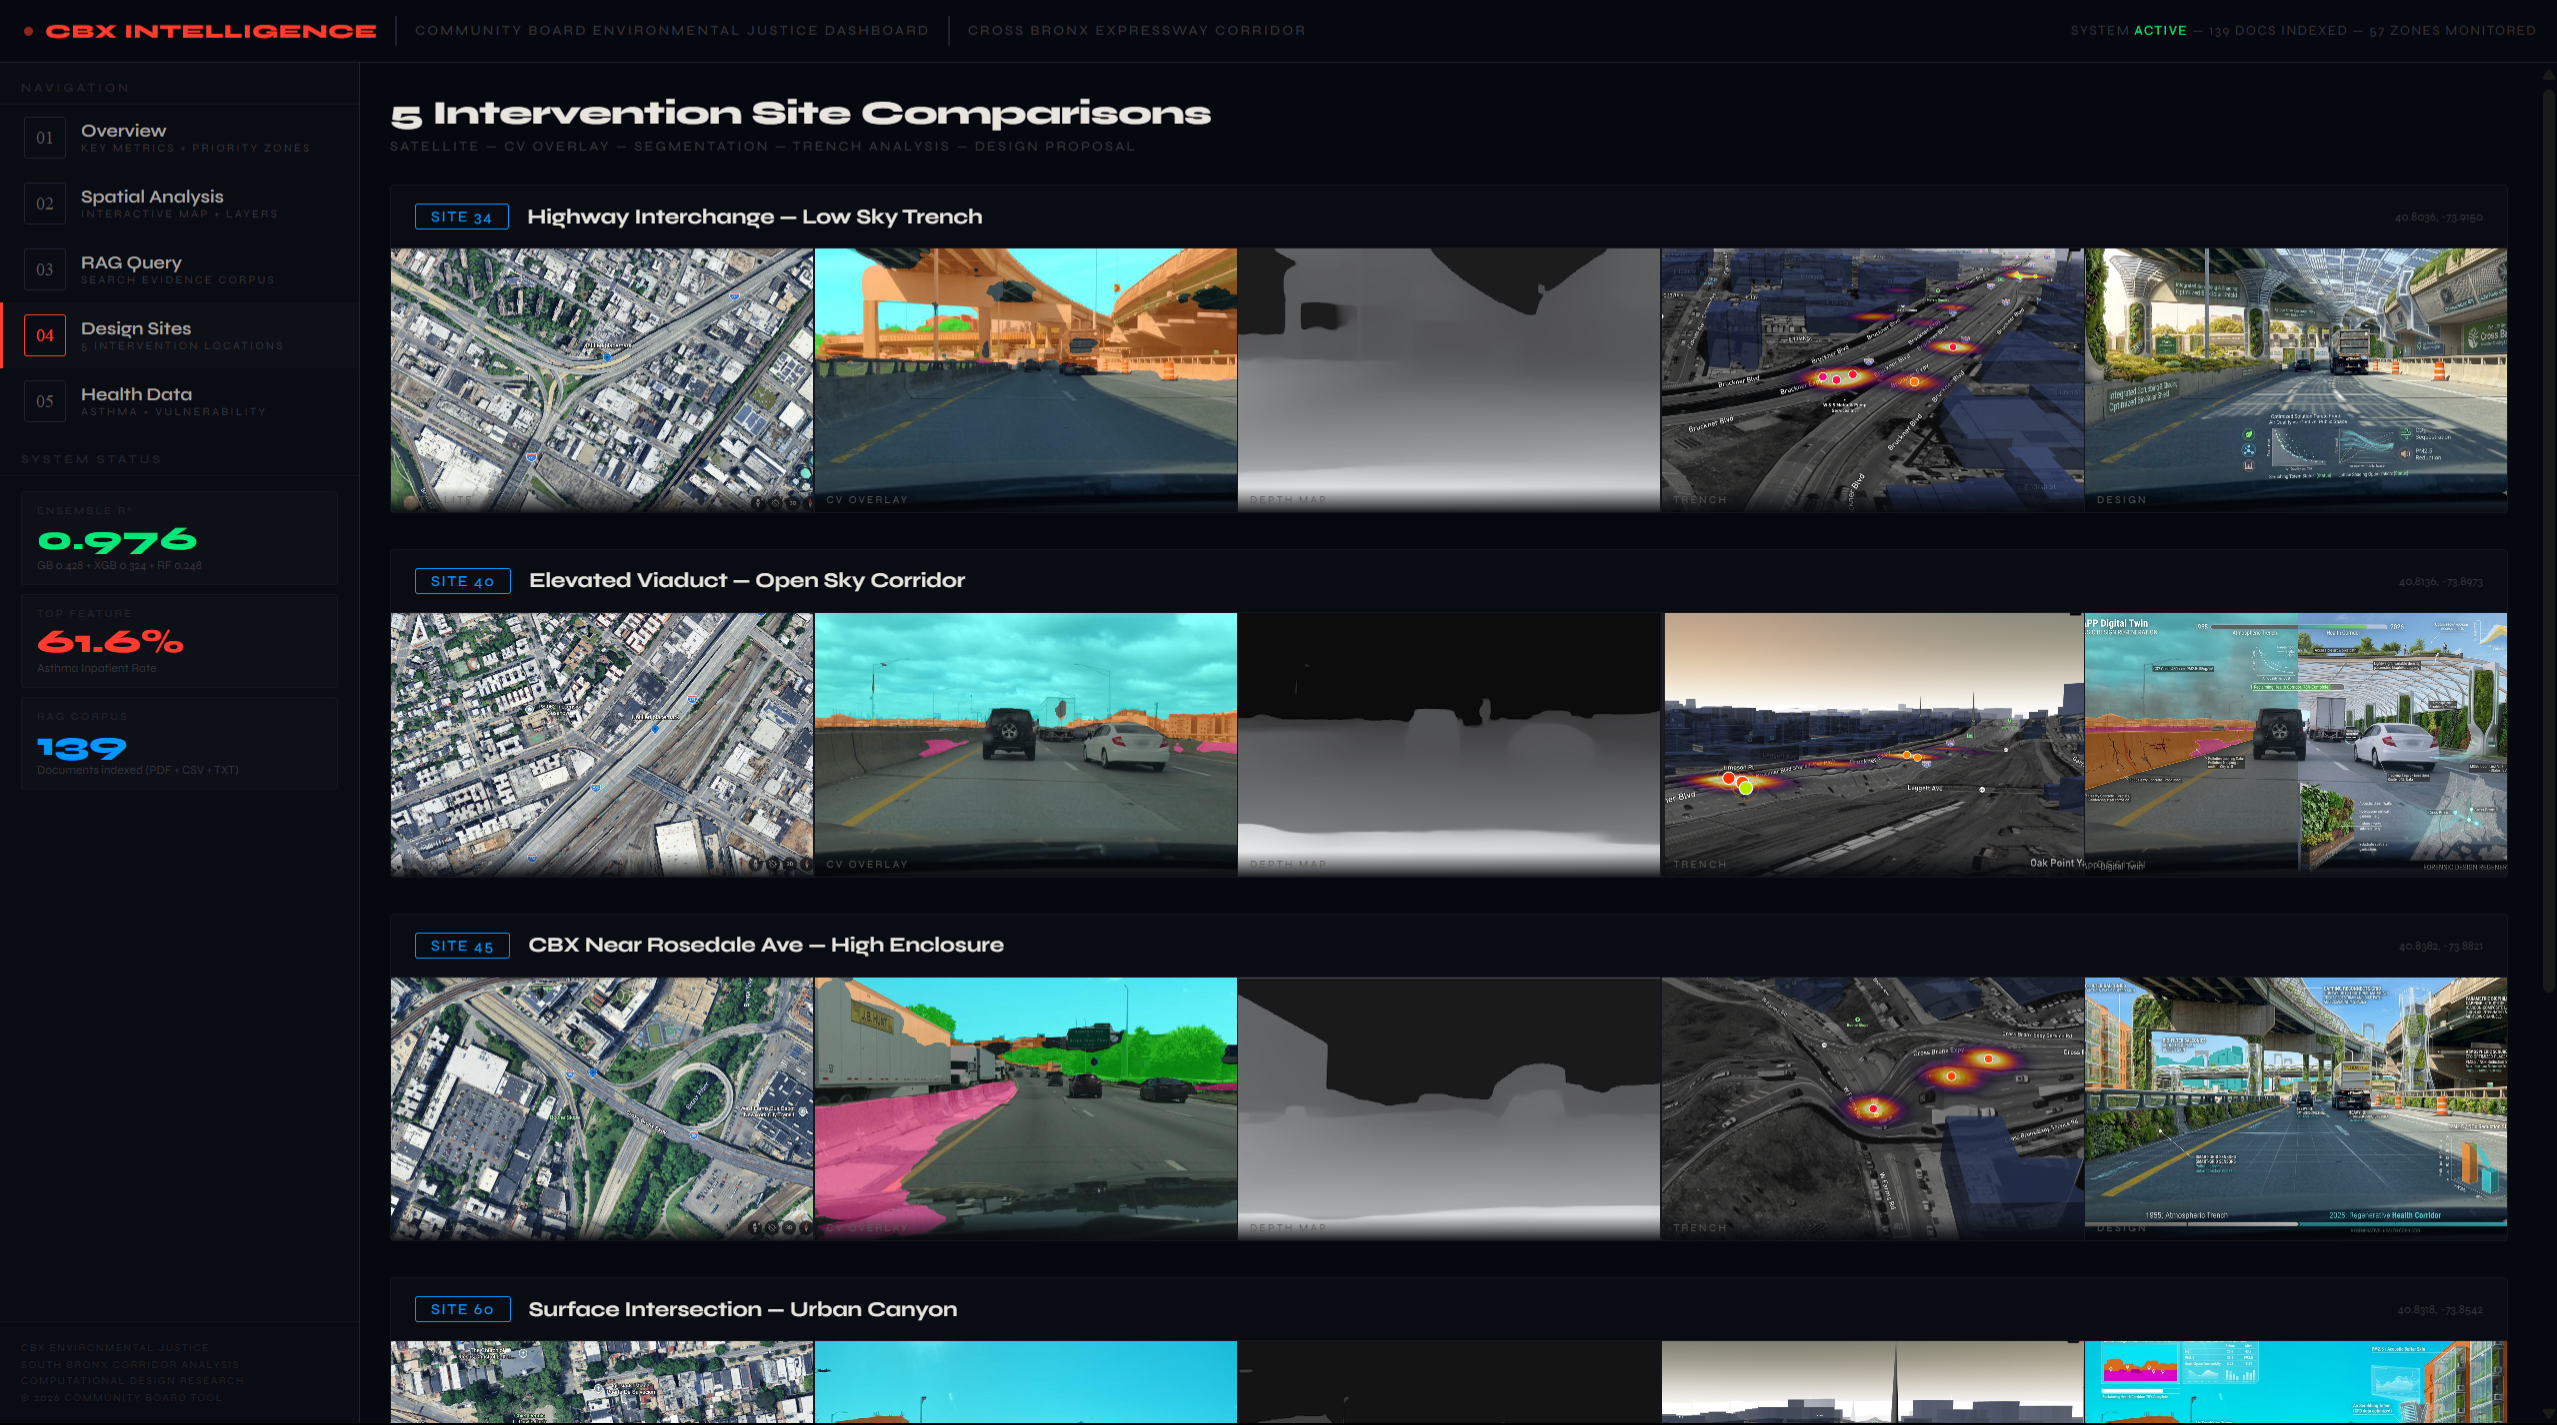
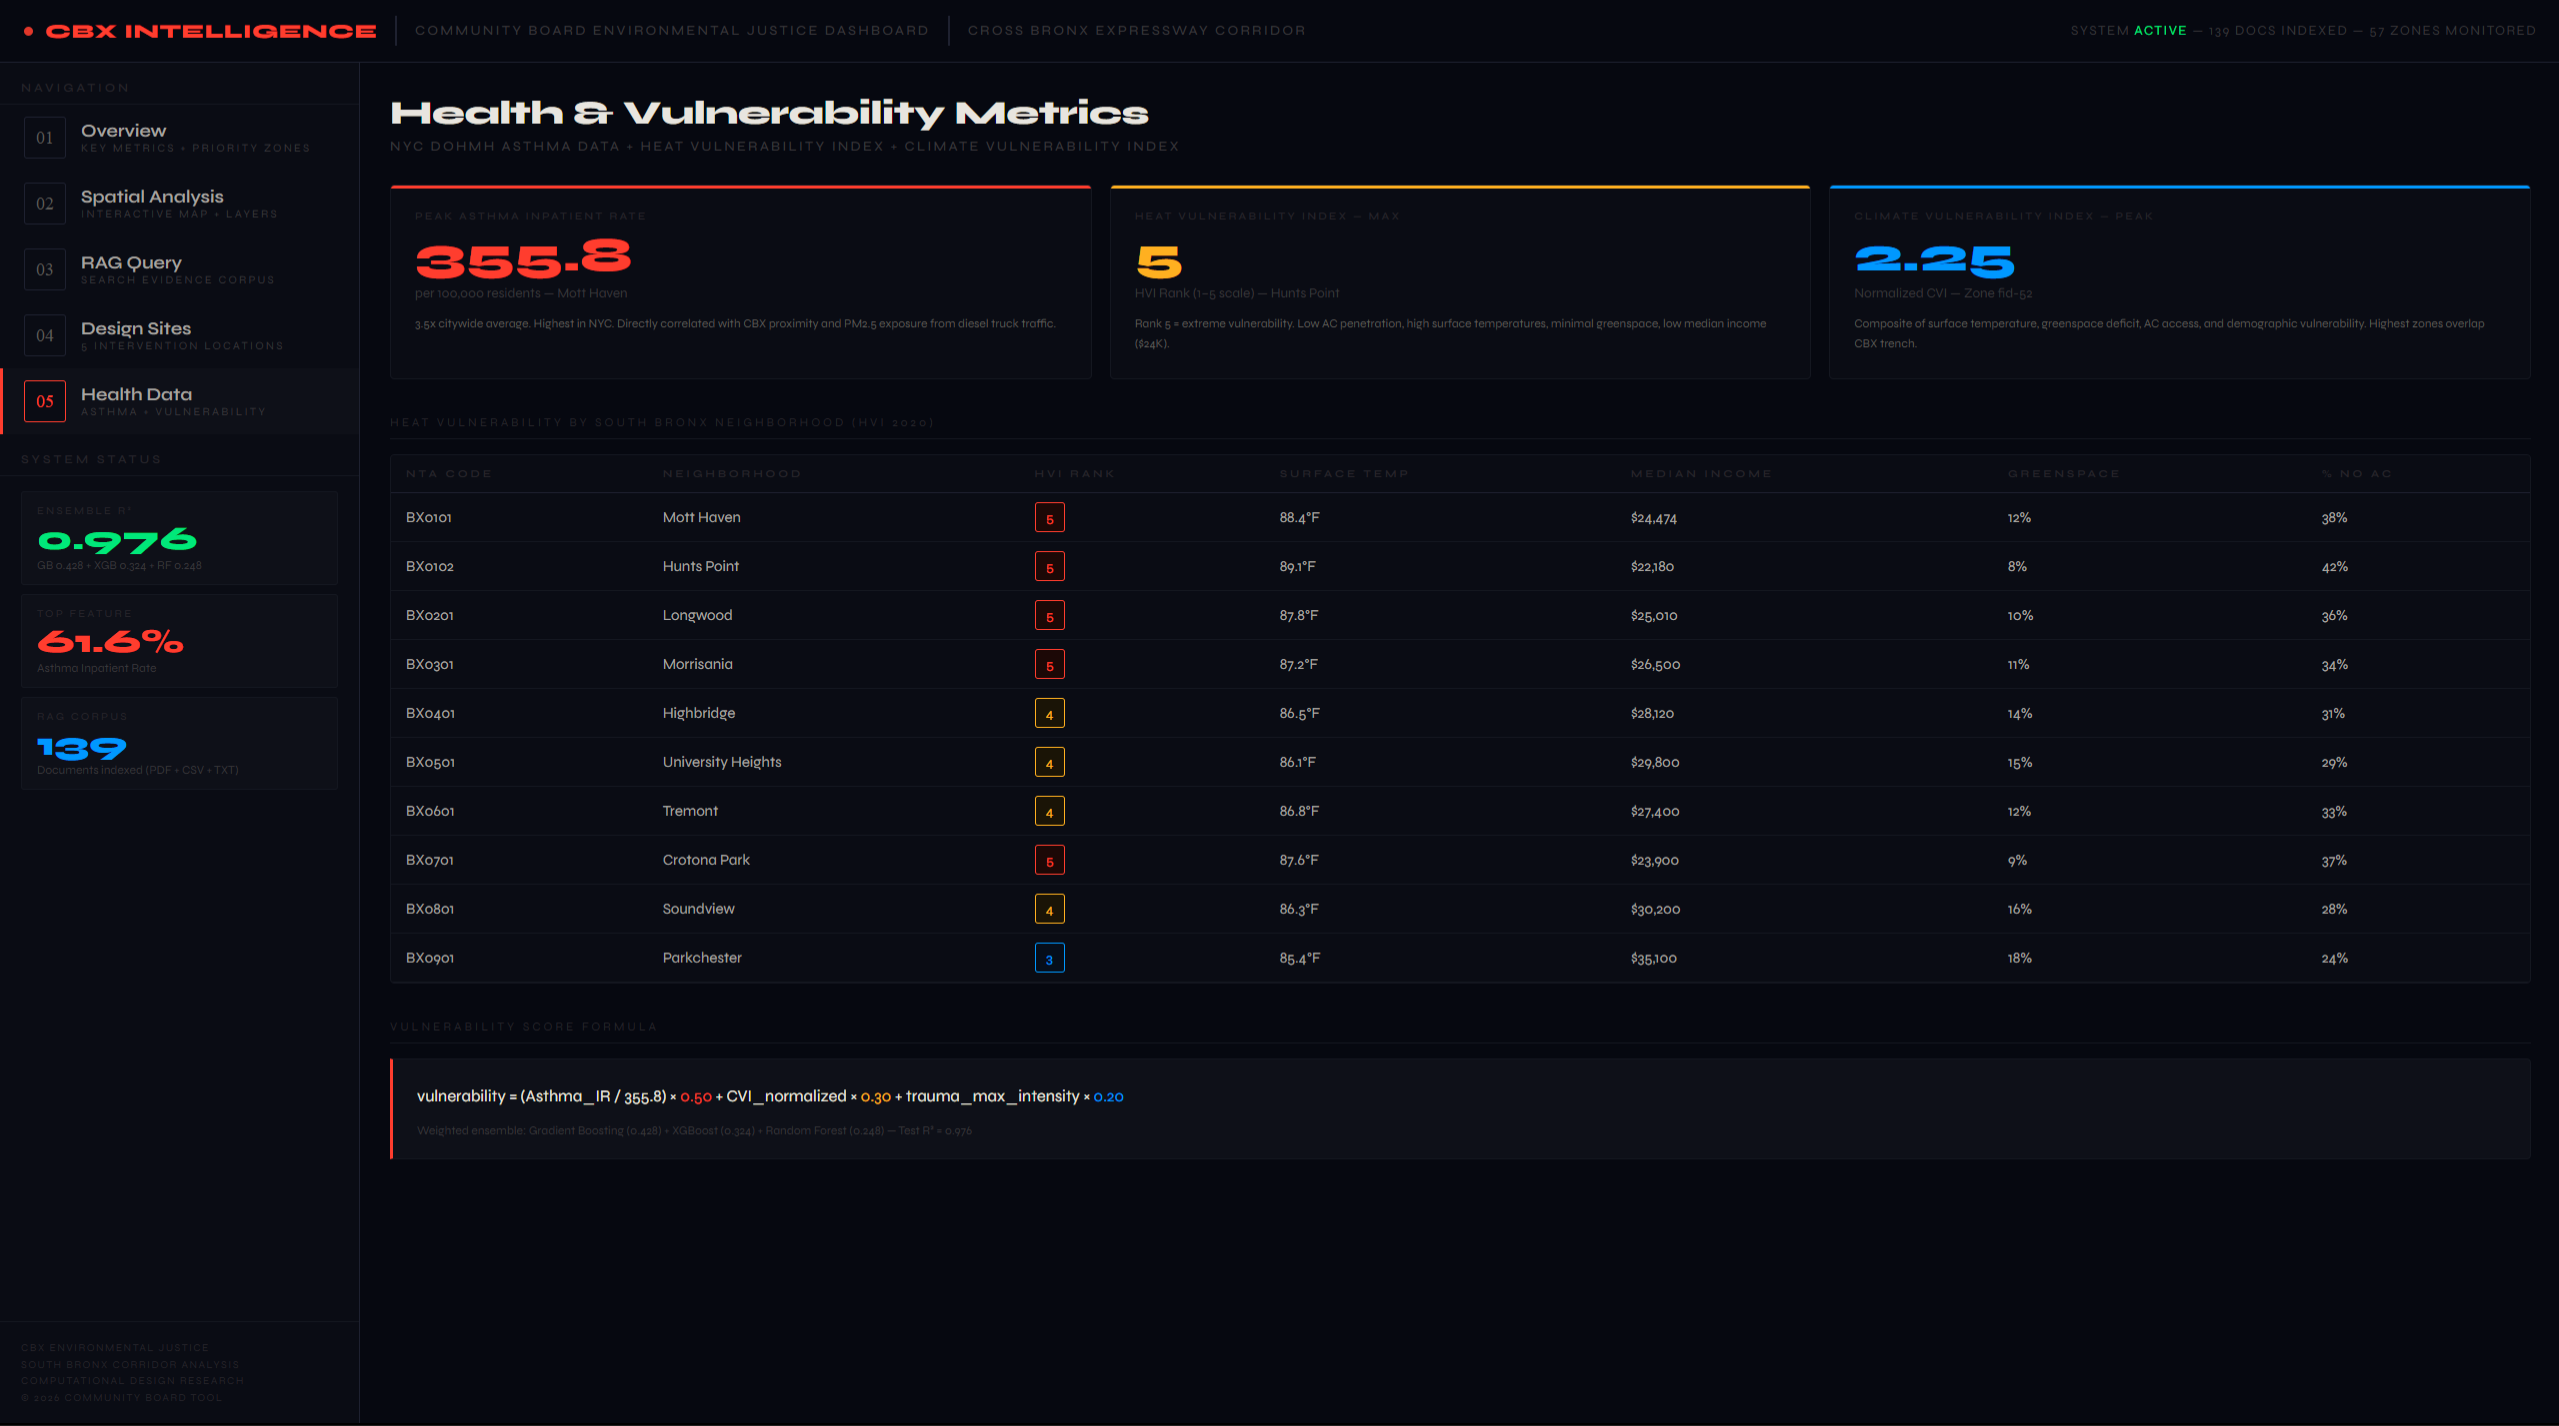
The final deliverable is not a paper or a poster. It is a tool. The community-facing dashboard integrates all seven computational layers into a single interface where a Community Board member can query the corpus ("what has been said about truck noise on Burnside Avenue?"), see the spatial distribution of trauma alongside health statistics, compare five intervention sites across satellite imagery, computer vision overlays, depth estimation maps, trench geometry analysis, and generative design proposals, and read the vulnerability formula that prioritizes their neighborhood[8:1]. The design decision to build this as a web tool rather than a printed report is itself a computational design practice argument: the evidence should be queryable, not static.
What computational design practice means here
This project does not use computation to describe the South Bronx from a distance. It constructs a pipeline where community testimony, street-level perception, institutional health data, environmental justice metrics, and parametric design proposals are held in the same computational frame — weighted, indexed, and queryable. The argument is not that machine learning can solve environmental injustice. The argument is that without computational integration of community voice into the same models that drive urban planning decisions, those decisions will continue to be made on institutional data alone — data that has failed the South Bronx for seventy years.
The CommunityAtlas project proved that computation can identify where vulnerability concentrates. This project asks what happens when you let the community tell you why.
Robert Caro, The Power Broker: Robert Moses and the Fall of New York (New York: Knopf, 1974), 850–894. ↩︎
Marshall Berman, All That Is Solid Melts into Air: The Experience of Modernity (New York: Penguin, 1988), 290–312. ↩︎
Justin D. Stewart and Peleg Kremer, "Temporal change in relationships between urban structure and surface temperature," Environment and Planning B: Urban Analytics and City Science 50, no. 4 (2022). DOI: 10.1177/23998083221083677. ↩︎
Evelyn Gonzalez, The Bronx (New York: Columbia University Press, 2004). ↩︎
Interview with Reece Brosco, Brownfields Program Manager, Youth Ministries for Peace and Justice (YMPJ), 1384 Stratford Ave, Bronx, NY 10472 (2026). Transcript indexed into RAG corpus. ↩︎
NYC Department of Health and Mental Hygiene, "Environment and Health Data Portal: Asthma Emergency Department Visits," NYC DOHMH (2023). ↩︎
Manish Pandey, Aman Arora, Alireza Arabameri, Romulus Costache, et al., "Flood Susceptibility Modeling in a Subtropical Humid Low-Relief Alluvial Plain Environment: Application of Novel Ensemble Machine Learning Approach," Frontiers in Earth Science 9 (2021). DOI: 10.3389/feart.2021.659296. ↩︎
U.S. Environmental Protection Agency, "EJScreen: Environmental Justice Screening and Mapping Tool," EPA (2024). ↩︎ ↩︎
Jill Jonnes, South Bronx Rising: The Rise, Fall, and Resurrection of an American City (New York: Fordham University Press, 2002). ↩︎