Topology of Mind
Minsup Chung
Introduction
Topology of Mind begins with a technological premise: a system that could generate architectural space in response to a specified emotional state. As affective computing, neural signal interpretation, and generative AI continue to mature, this possibility no longer belongs only to fiction. A future tool might read physiological or brain-derived signals, infer an affective condition, and produce spatial configurations calibrated to that condition.
The project is not primarily concerned with building that tool. It uses the possibility of such a tool as a lens. If emotional and spatial mapping becomes automatable, what does this reveal about the way this era understands emotion, knowledge, and design? What kind of world must be assumed before feeling can be treated as data, space as output, and experience as something that can be optimized?
This speculative artifact therefore works less as a solution than as a conceptual probe. It constructs a chain between visual stimuli, neural activity, topological structure, prediction, and image generation in order to ask how human experience becomes legible to machines, and how machine-scale representations might be returned to human perception.
Knowing as Relation
Human knowledge is often described through two complementary procedures. Deduction extends relations inside an existing logical structure. It strengthens coherence, but it does not introduce fundamentally new information. Induction moves in the opposite direction: it extracts relational patterns from repeated experience, filters noise, and builds models from observed regularities.
From this perspective, knowledge is not the accumulation of isolated facts. It is the ability to grasp relational structure. A thing does not carry meaning by itself; it gains meaning through its position in a field of other things. A line becomes a boundary, a gradient becomes atmosphere, a repeated transition becomes rhythm, and a stimulus becomes significant because it participates in a wider pattern of relations.
Biological and artificial neural systems operate in this relational manner. They do not store "sky" as a fixed image. They learn configurations: color gradients, spatial orientation, edges, horizons, depth cues, atmospheric context, and repeated associations. In both cognition and machine learning, induction builds the relational field, while reasoning navigates it.
The difficulty is that these relational fields now exceed the scale of ordinary human intuition. Human perception evolved for low-dimensional sensory environments. Neural recordings and artificial intelligence systems, by contrast, operate in high-dimensional spaces where thousands of signals may change together. Their internal structures may be mathematically tractable while remaining perceptually inaccessible.
Topology of Mind treats this gap as a design problem. Topological Data Analysis offers one strategy for translating high-dimensional relations into forms that can be seen, compared, and interpreted. In this project, topology is not only a visualization technique. It becomes an interface between machine-scale structure and human-scale comprehension.
Data: Visual Experience as Neural Activity
The project uses the Allen Brain Observatory Visual Coding Neuropixels dataset, a large-scale record of neural activity from mice viewing controlled visual stimuli. The selected session is 779839471, from mouse 760960653. The analysis focuses on seven exported regions: VISp, VISl, VISam, VISpm, VISrl, CA1, and DG. These regions create a field that includes visual cortical areas as well as hippocampal structures associated with memory, transition, and contextual organization.
The working dataset contains 477 target units from the initial session selection. For the website export, the project prepares 135,275 source unit rows, 114,359 positioned and exported units, 284 probe tracks, and 170 stimulus conditions. The stimuli include drifting gratings, flashes, gabors, natural movie one, natural movie three, natural scenes, and static gratings. Spontaneous activity is excluded from the site-facing stimulus set so that the interface can focus on the relation between visual input and evoked neural structure.





The dataset is not treated as a collection of images with labels. It is treated as a sequence of transformations: visual conditions produce patterns of spikes; spikes become population activity; population activity becomes a manifold; the manifold is tested for topological structure; that structure becomes a coordinate system that can be predicted, manipulated, and decoded.
Process: From Spikes to Shape
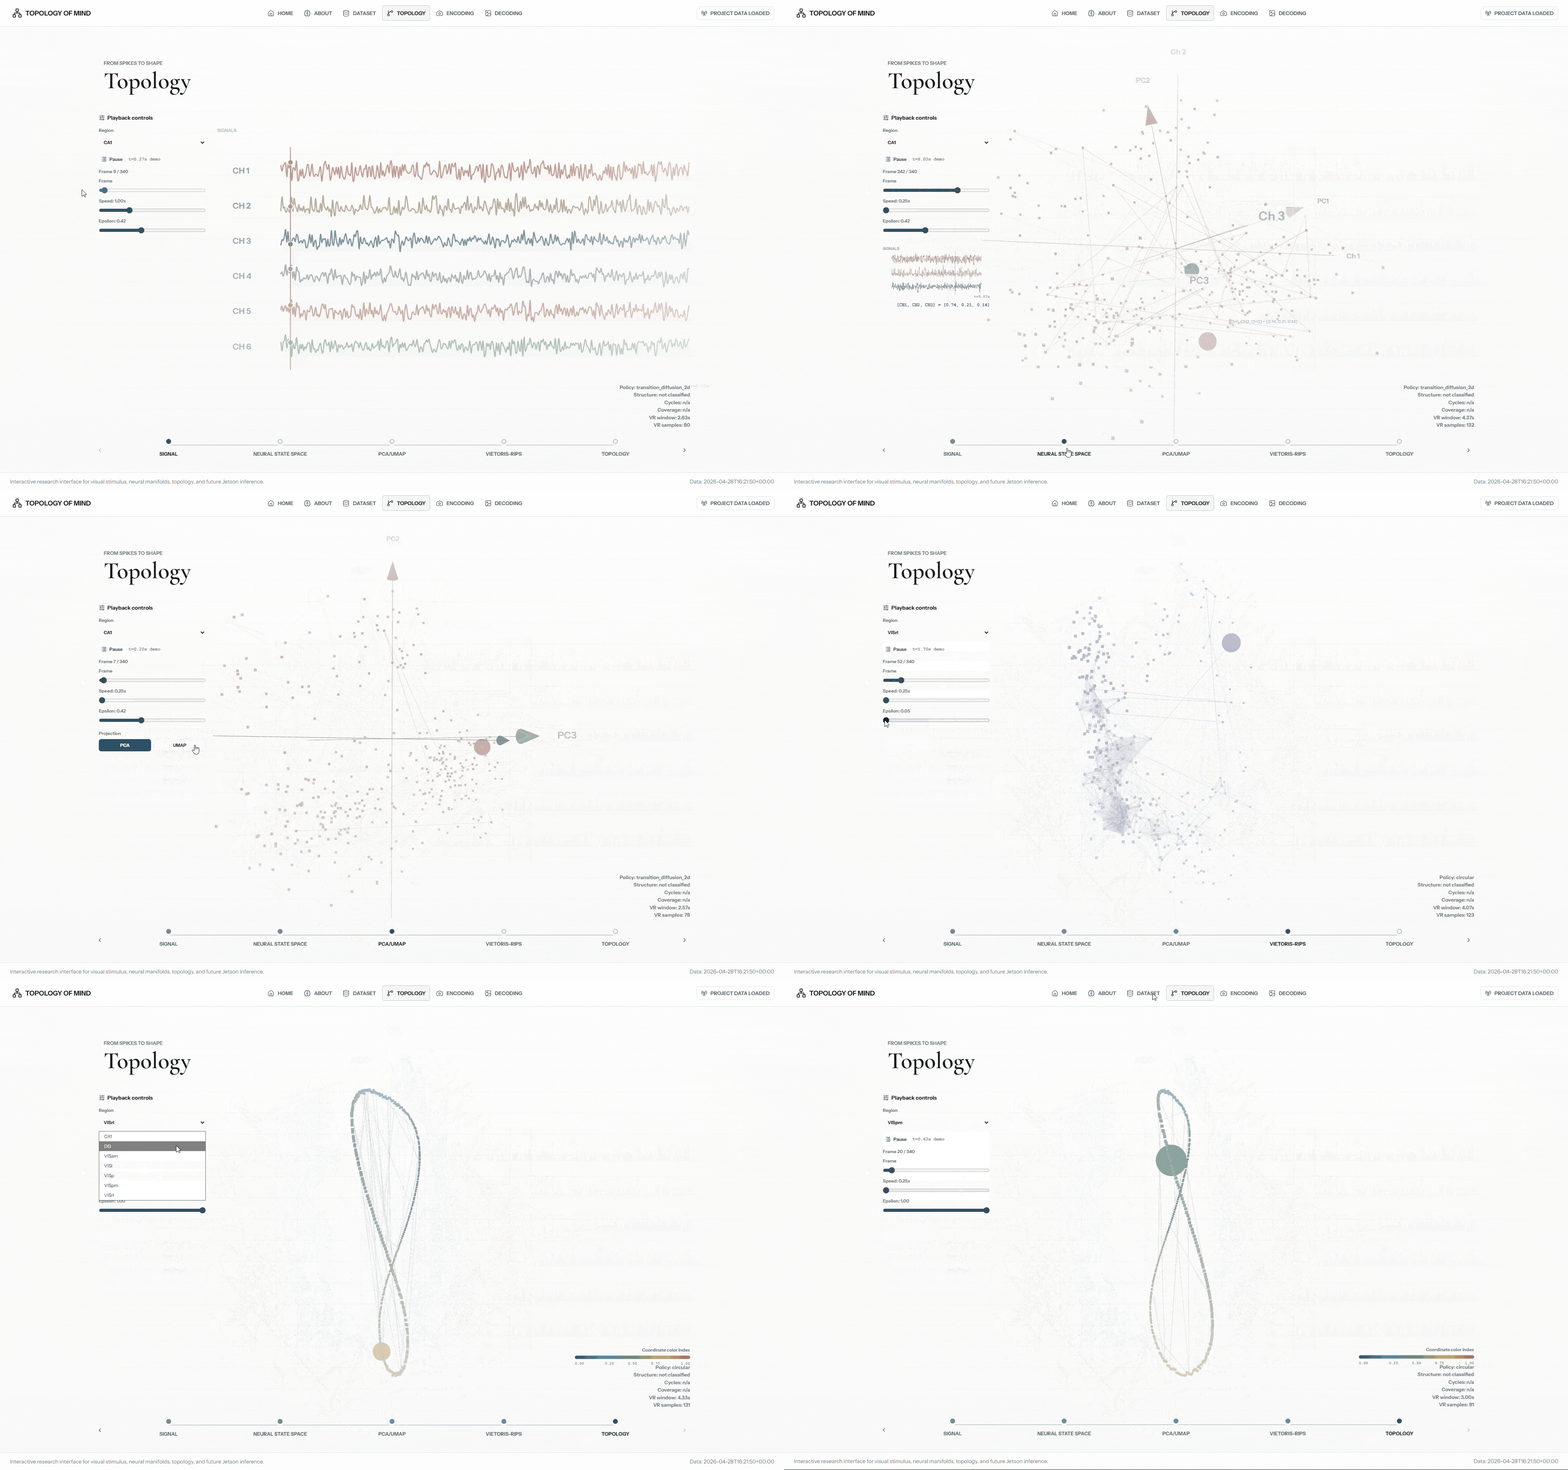
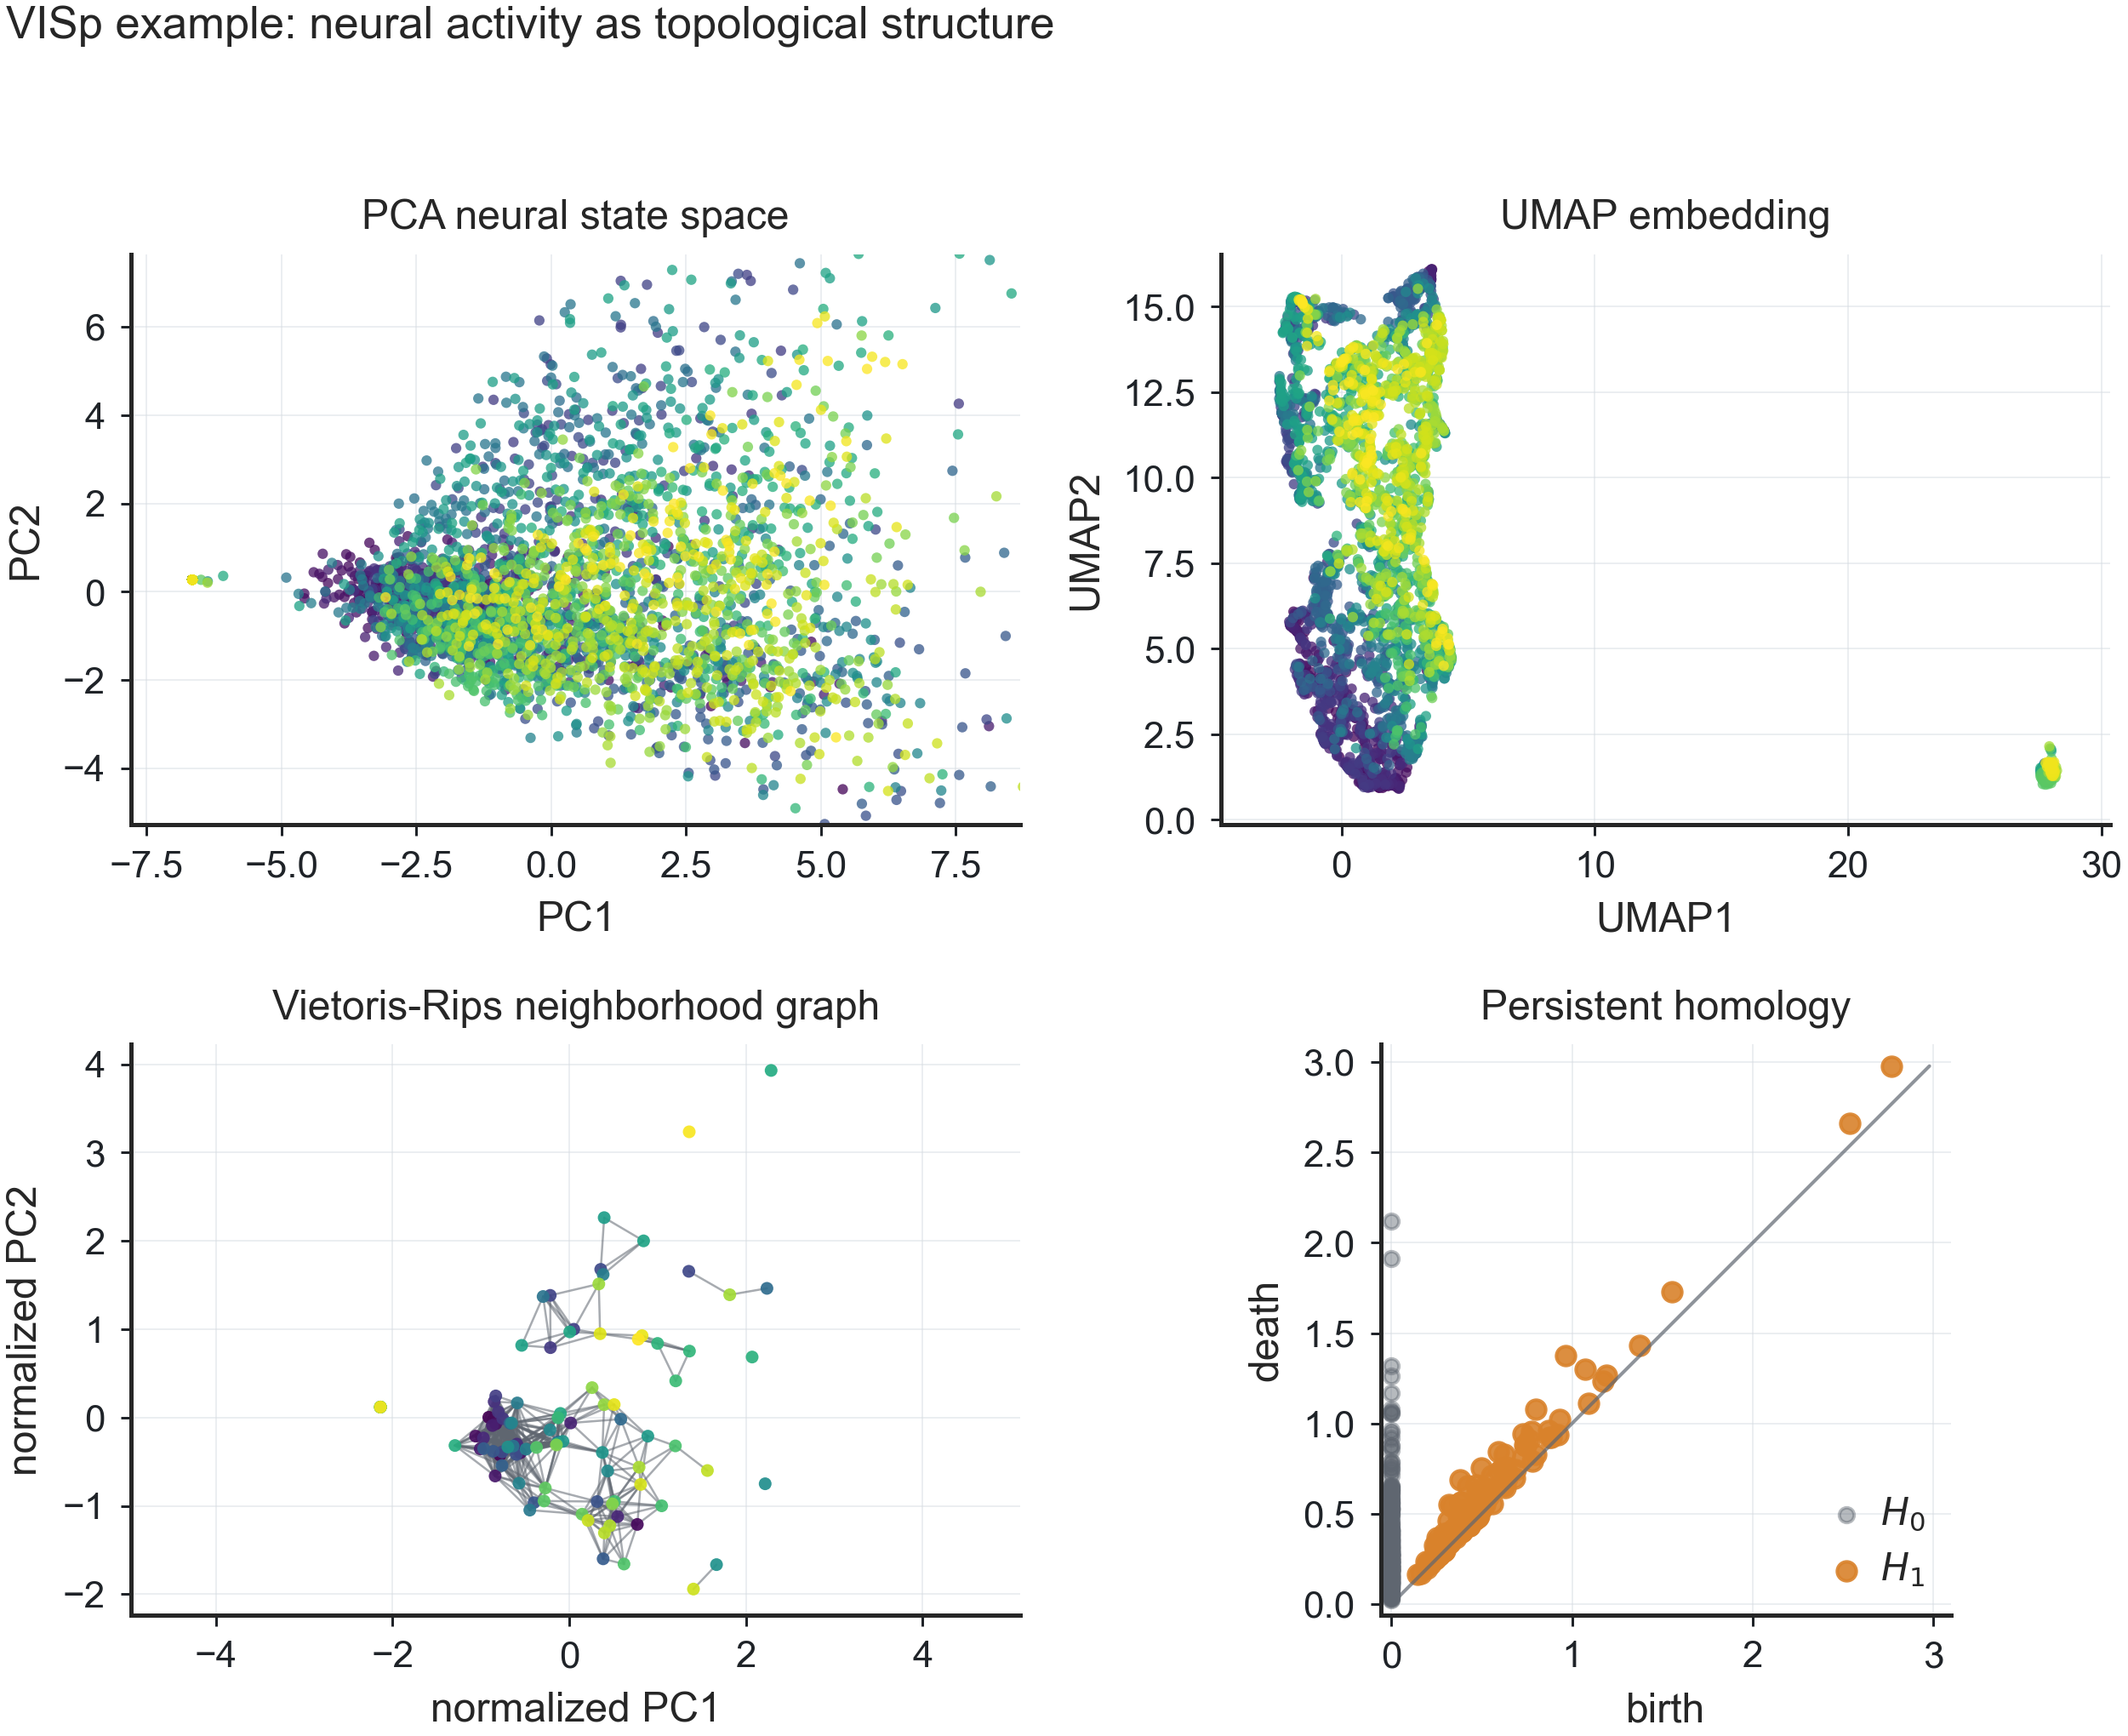
A VISp example makes the passage from spikes to shape visible: the same regional population activity is projected as a PCA state space, reorganized through UMAP, connected as a Vietoris-Rips neighborhood graph, and read through persistent homology as a diagram of births and deaths.
The processing pipeline begins with session selection and loading through the AllenSDK. Spike times are organized by brain region and aligned to stimulus presentations. These spike events are then binned into 50 ms windows, smoothed, and z-score normalized to form population activity matrices. At this point, the object of study is no longer a single neuron, but the changing state of a regional neural population.
Mathematically, the first transformation converts spike events into a population vector. For neuron $i$ in region $r$, spike times $s_{i,k}$ are counted inside a time bin of width $\Delta t = 50\,\mathrm{ms}$:
Those counts are smoothed and normalized so that each time point becomes a comparable regional state vector:
Stacking these vectors through time produces the matrix analyzed downstream:
Dimensionality reduction then translates those population states into manifold spaces. PCA provides three-dimensional trajectories for visualization and higher-dimensional projections for topology; UMAP offers an additional view of neighborhood structure. These projections do not claim to show the brain directly. They make relational patterns in neural activity available to inspection.
The PCA projection is written as:
Here $\mathbf{z}_r(t)$ is not a picture of a brain state, but a lower-dimensional coordinate for the relation among many neurons at that moment.
Persistent homology is then used to ask what kinds of structures persist inside those manifolds. The analysis looks for connected components, loops, and higher-dimensional features, and it validates them through parameter sweeps, bootstrap stability, and null model comparisons. This matters because topology can easily become decorative if it is not tested. The project therefore treats topological form as something that must earn its interpretive force.
For a projected point cloud $P_r=\{\mathbf{z}_r(t_j)\}_{j=1}^{T}$, the Vietoris-Rips complex at scale $\epsilon$ is:
As $\epsilon$ grows, this creates a filtration of spaces. Persistent homology records when a topological feature is born and when it dies:
Long-lived features, such as stable $H_1$ loops, become candidates for meaningful relational structure rather than momentary noise.
After validation, each region receives a topology-specific coordinate policy. VISpm and VISrl are represented through circular coordinates derived from single dominant loops. CA1 is modeled through transition diffusion coordinates, reflecting a less stable, state-like geometry. DG is represented through density and diffusion coordinates. VISp, VISl, and VISam use principal component coordinates when their topology is better understood as local graph fragments than as a single clean loop. These policies are merged into a canonical table of topological coordinates, allowing each visual condition to be read as a position within a regional relational structure.
For loop-like regions, the coordinate is circular:
The encoding model receives this circular variable as a continuous target:
For regions better described by transitions or density, diffusion coordinates summarize neighborhood flow:
Across these policies, the project translates neural activity into a coordinate language: not an explanation of consciousness, but a structured surface on which visual experience can be compared, predicted, and eventually designed with.
Encoding and Decoding
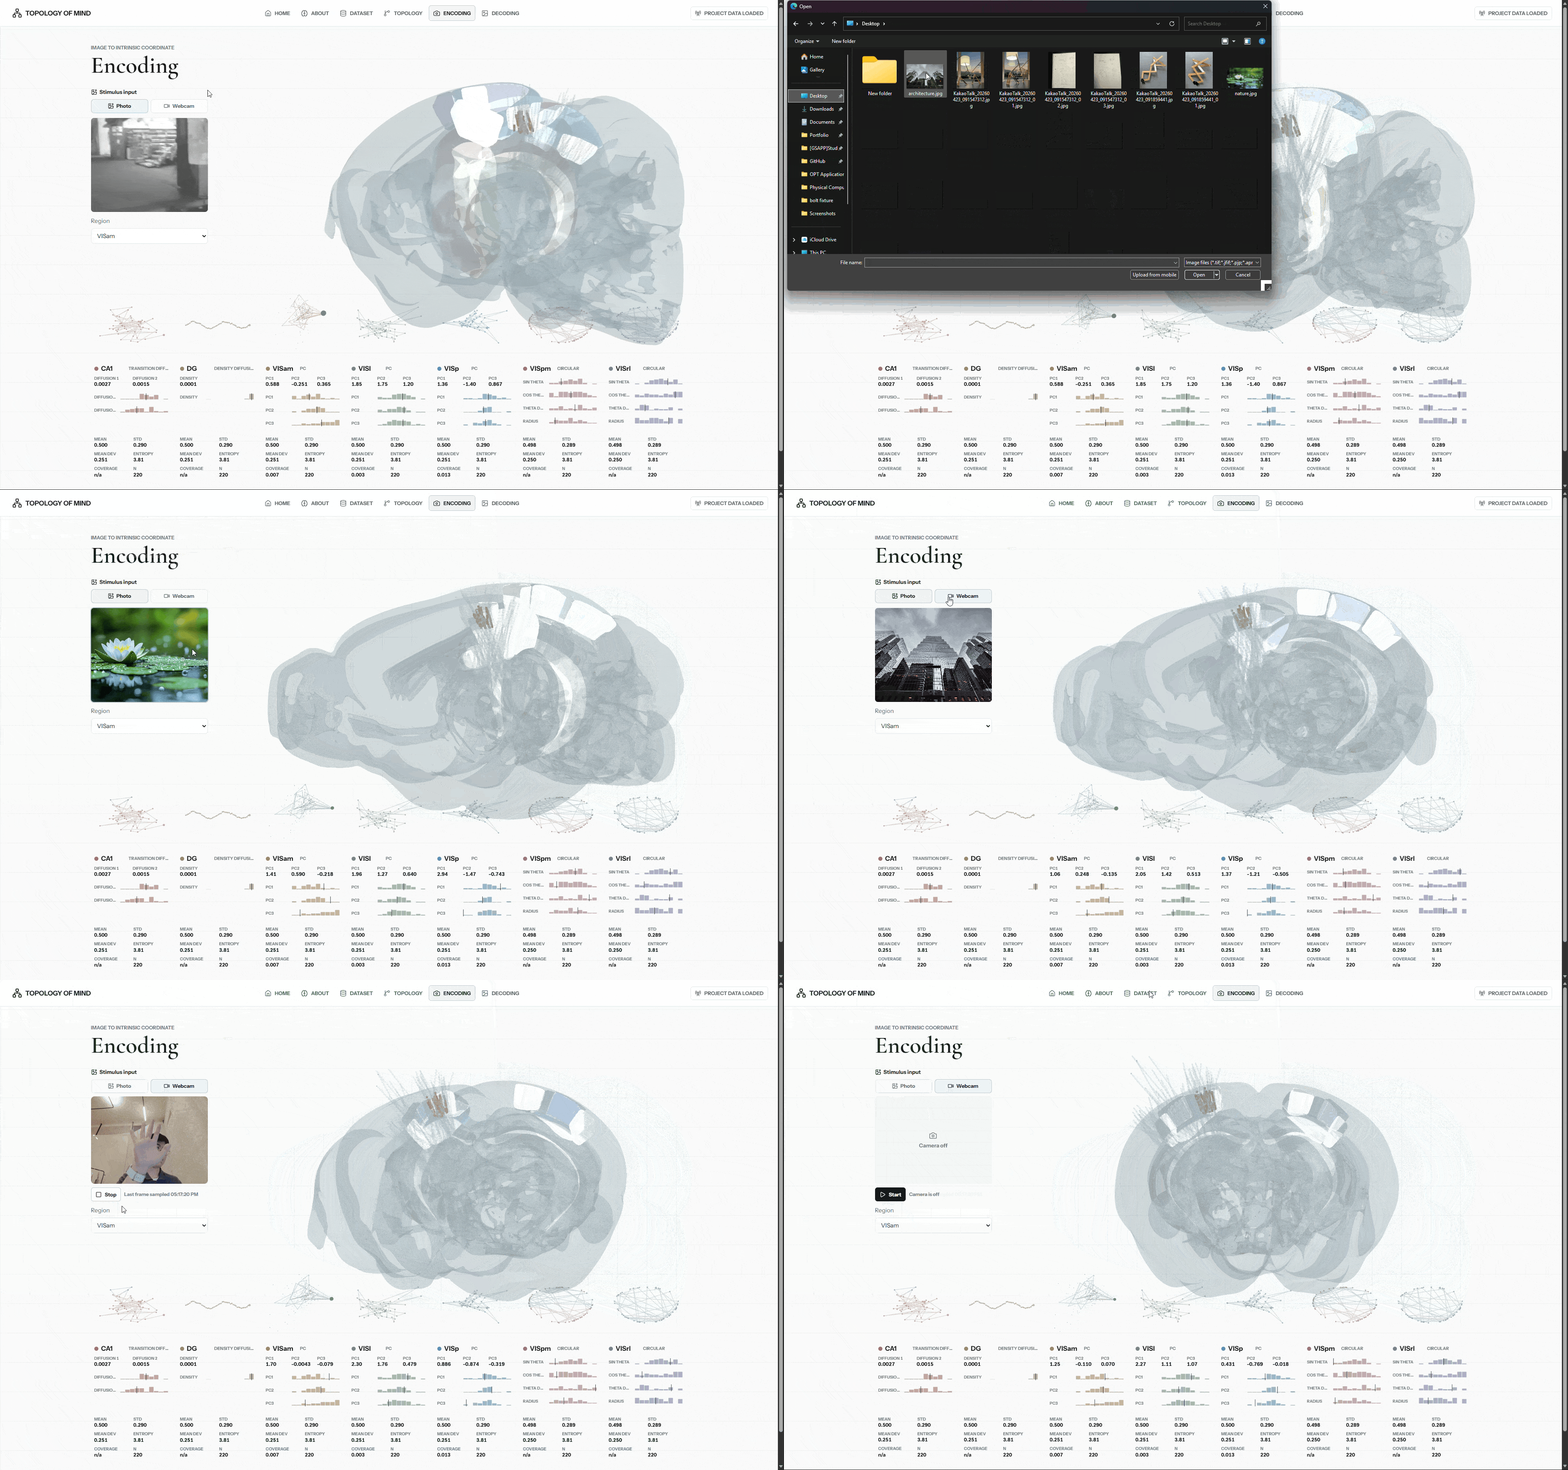
The predictive models ask whether this topological coordinate system can become operational. The encoding model translates image stimulus into neural coordinate. A frozen CNN-style visual encoder extracts image features, and region-specific heads predict the appropriate coordinate targets for each brain region. The target format changes with the topology of the region: sin and cos for circular coordinates, diffusion coordinates for unstable structures, and PC coordinates for regions whose usable geometry remains more fragmentary.
This is not presented as a final theory of perception. The validation metrics show a partial and uneven mapping. Visual cortical regions produce modest positive predictive structure, while less stable regions reveal the difficulty of compressing biological dynamics into controllable coordinates. That unevenness is important. It keeps the project from turning the brain into a simple input-output device.
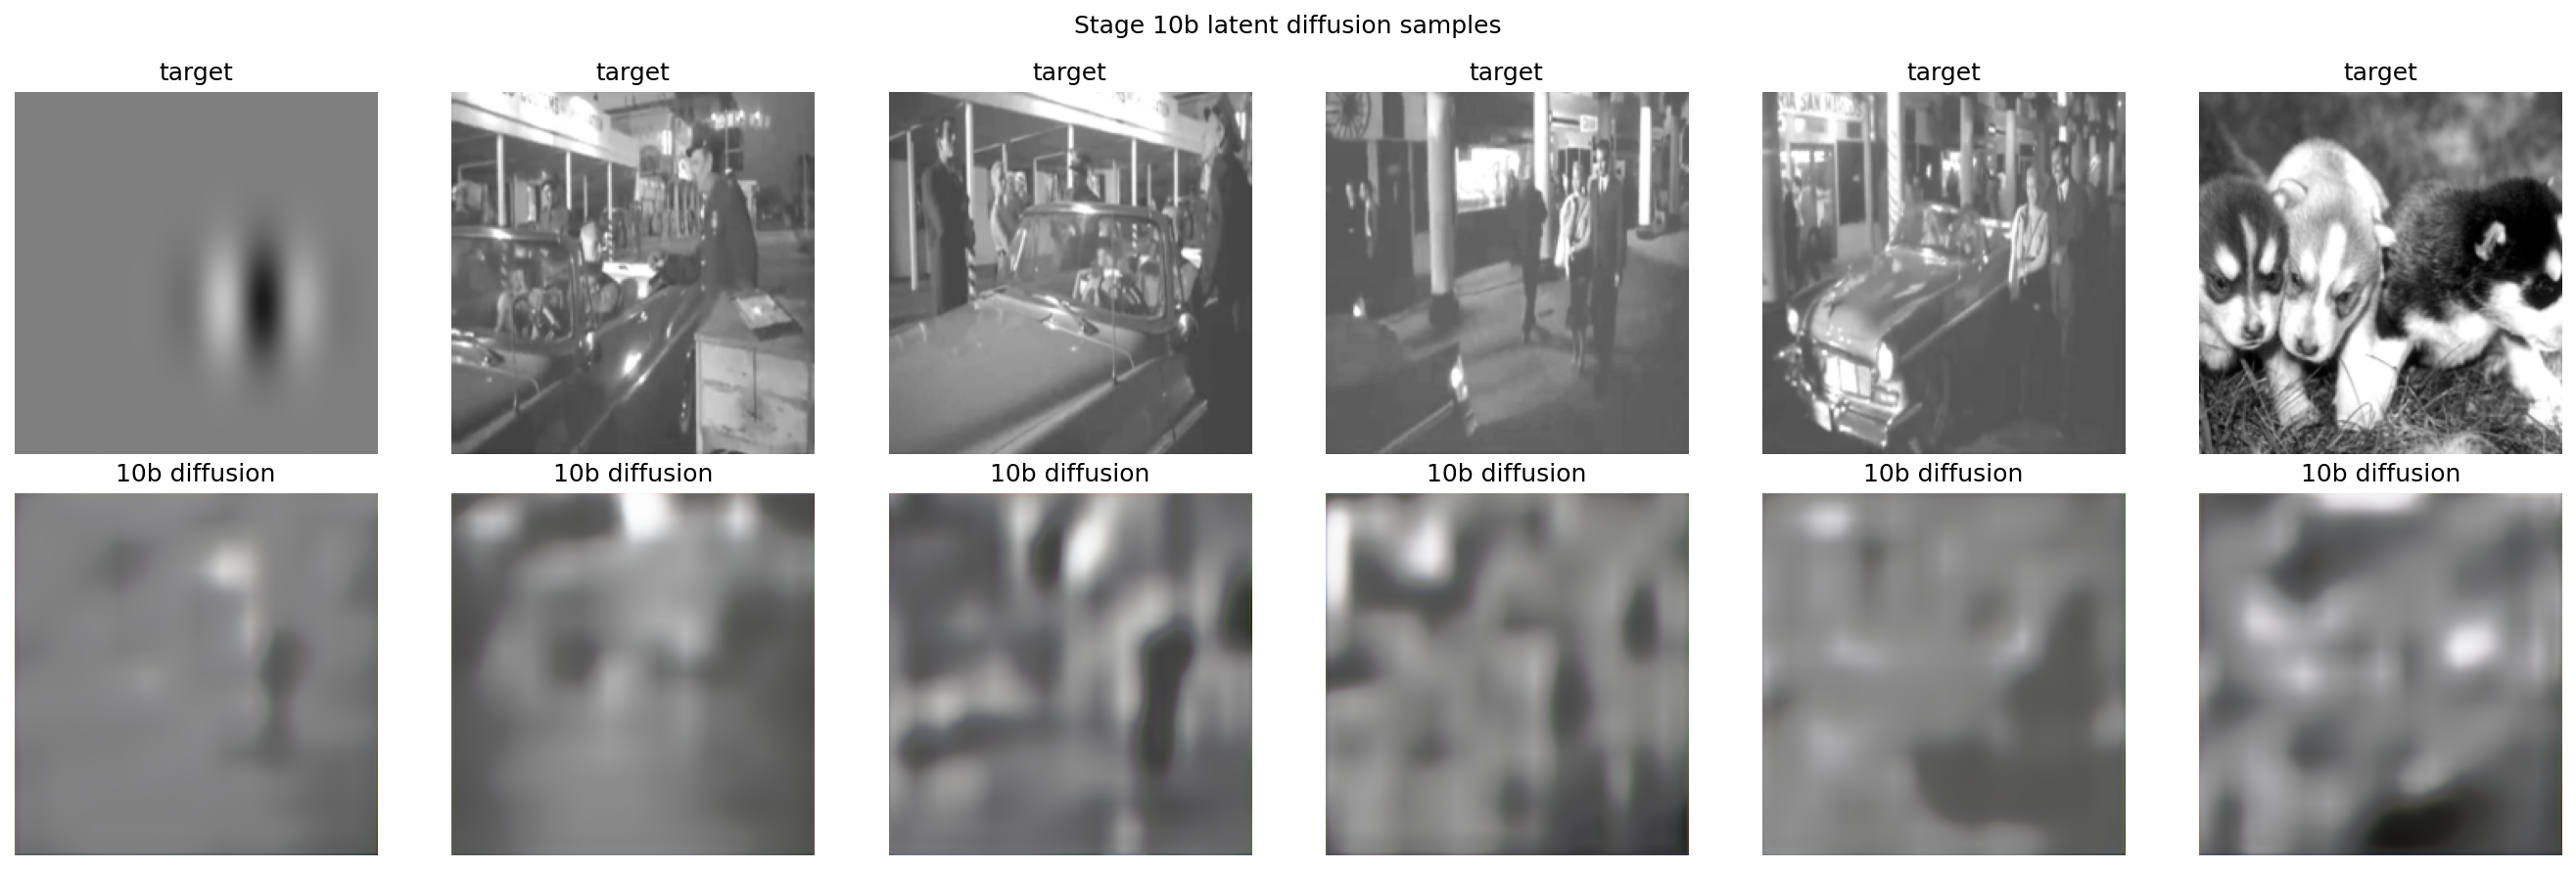
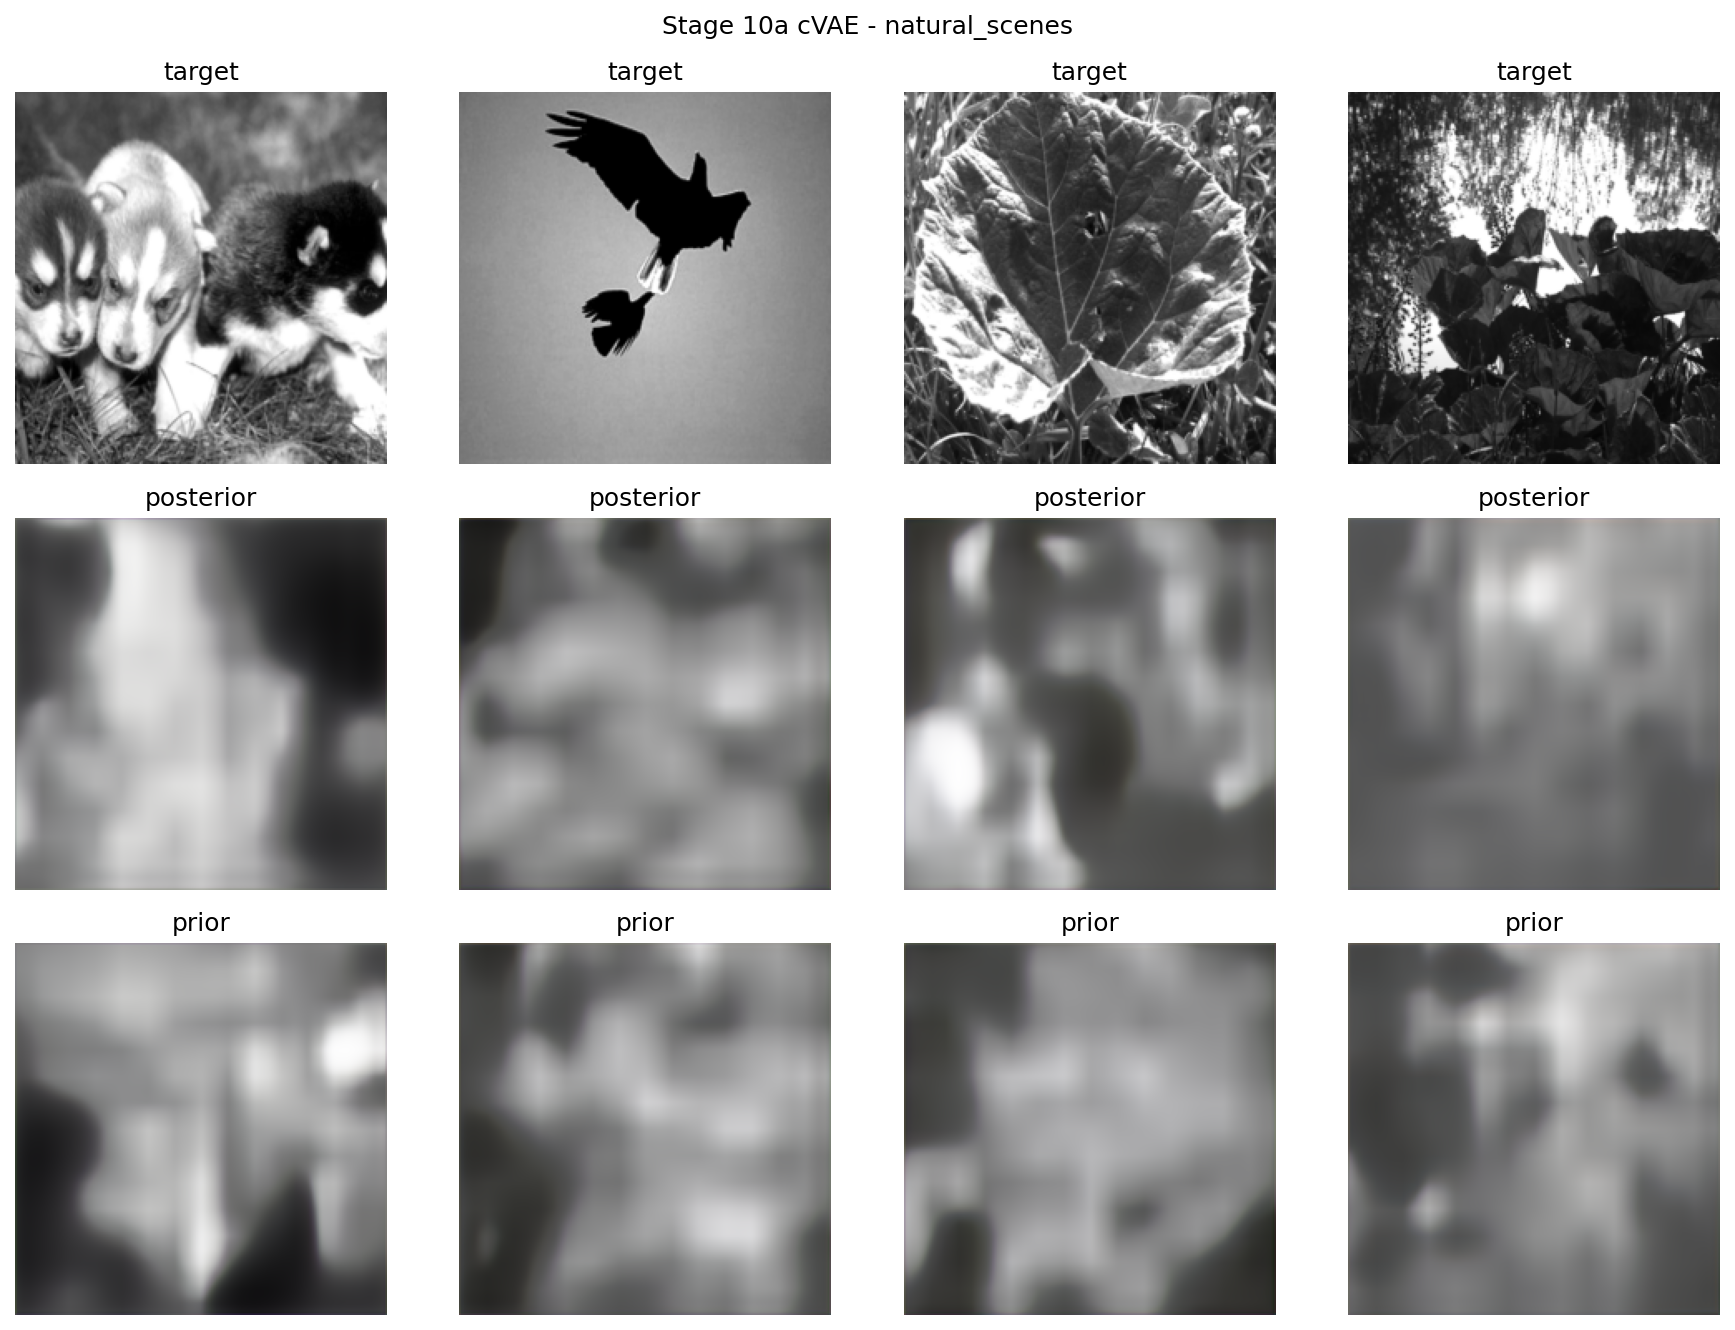
The decoding model reverses the direction. Instead of predicting neural coordinates from images, it explores whether a coordinate vector can condition image reconstruction or generation. A conditional VAE and a latent diffusion prior become ways to ask what kind of visual field is implied by a point in topological neural space. The generated images are not the goal in themselves. They are evidence that the coordinate system can become a medium: a manipulable structure through which perception can be composed, varied, and returned as image.
The Website as Interface
The website is the project's public-facing research artifact. It does not simply document the pipeline; it presents the pipeline as an interface.
On the home screen, Topology of Mind is introduced as a mapping of visual experience into the hidden geometry of neural activity. The page foregrounds the scale of the data: seven regions, 222,537 visual rows, and 182,703 samples per region. The manifold selector lets the viewer move between PCA, UMAP, and topological coordinate fields, presenting the dataset as a set of navigable spatial hypotheses rather than a static chart.
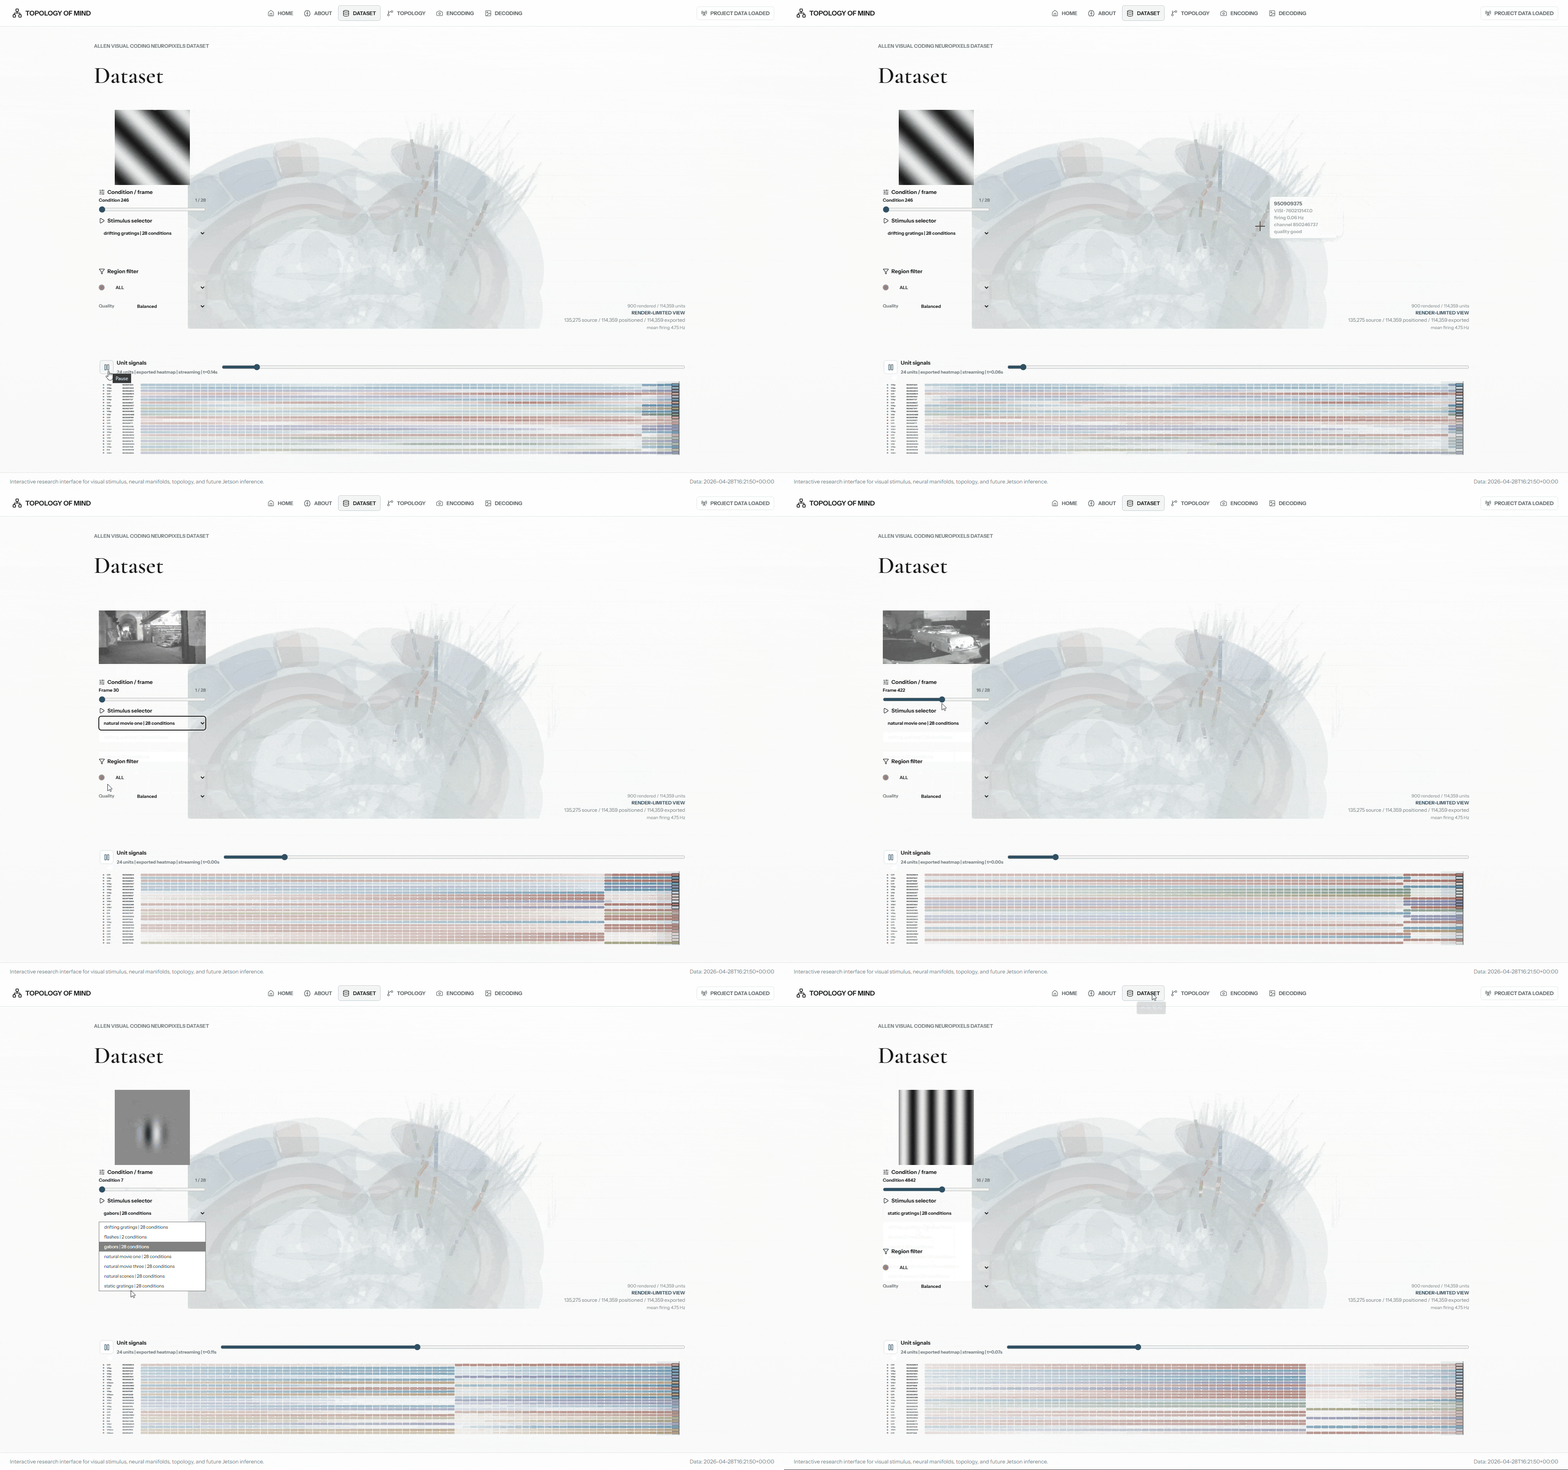
The Dataset tab links stimulus conditions to brain anatomy and neural signal traces. It places natural scenes, gratings, and other controlled inputs beside regional units and probe positions, making the apparatus of measurement visible. The Topology tab turns the analysis into a visible transformation: signal, neural state space, PCA/UMAP, Vietoris-Rips construction, and topology. The user watches spikes become shape.
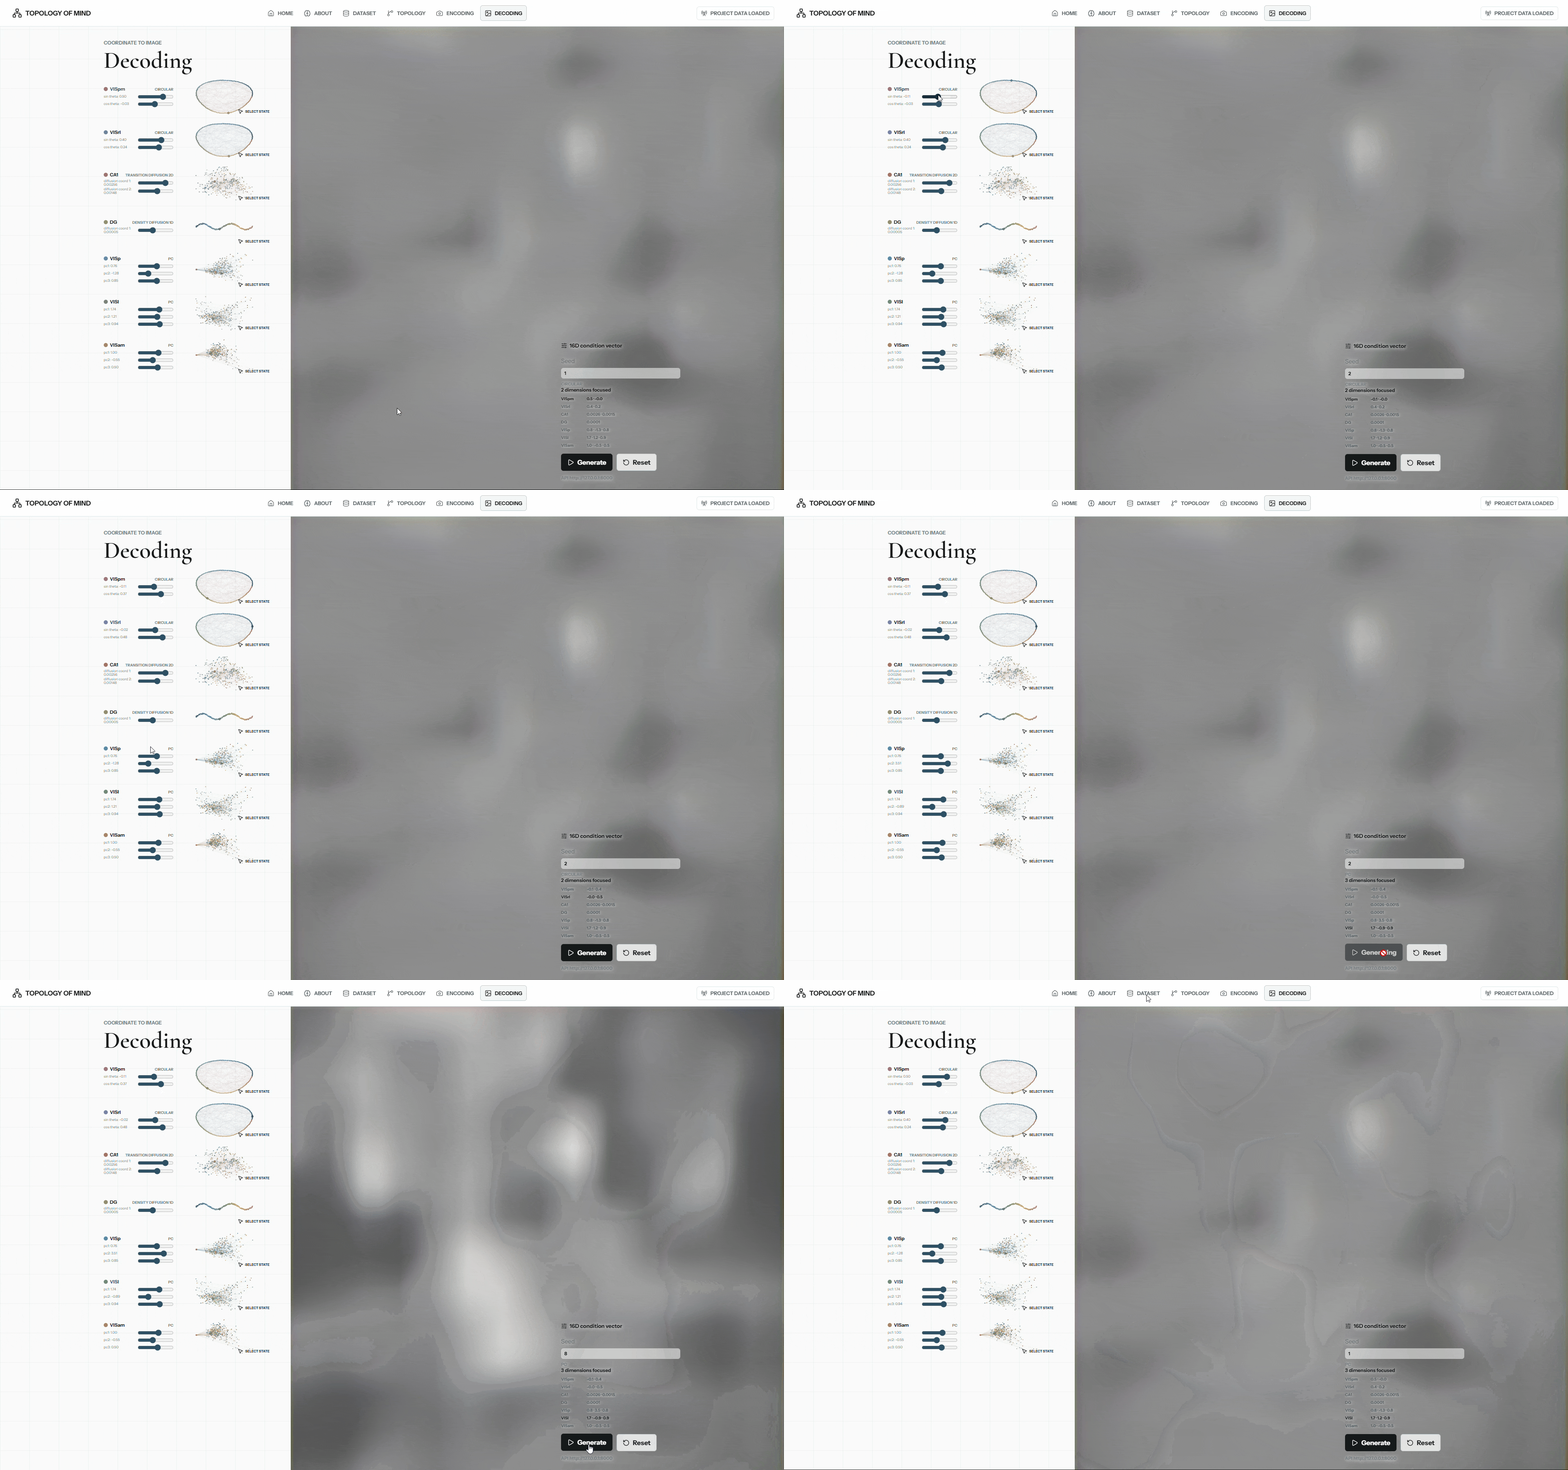
The Encoding tab tests the forward relation from image to coordinate. An uploaded image or webcam frame can be interpreted through the trained model, producing predicted coordinates for each region and highlighting their positions within the topology atlas. The Decoding tab moves in the reverse direction. It lets the viewer adjust region-specific coordinates and request an image implied by that configuration. Together, these tabs make the central question tangible: if experience can be placed in a coordinate system, what kinds of authorship become possible?
Design After Induction
Design and art can be understood as practices that shape structures capable of eliciting emotional responses. Traditionally, designers develop this capacity through long cycles of exposure, intuition, feedback, and revision. This is an inductive process. In architecture, it is especially slow because feedback often arrives only after construction, occupation, and use.
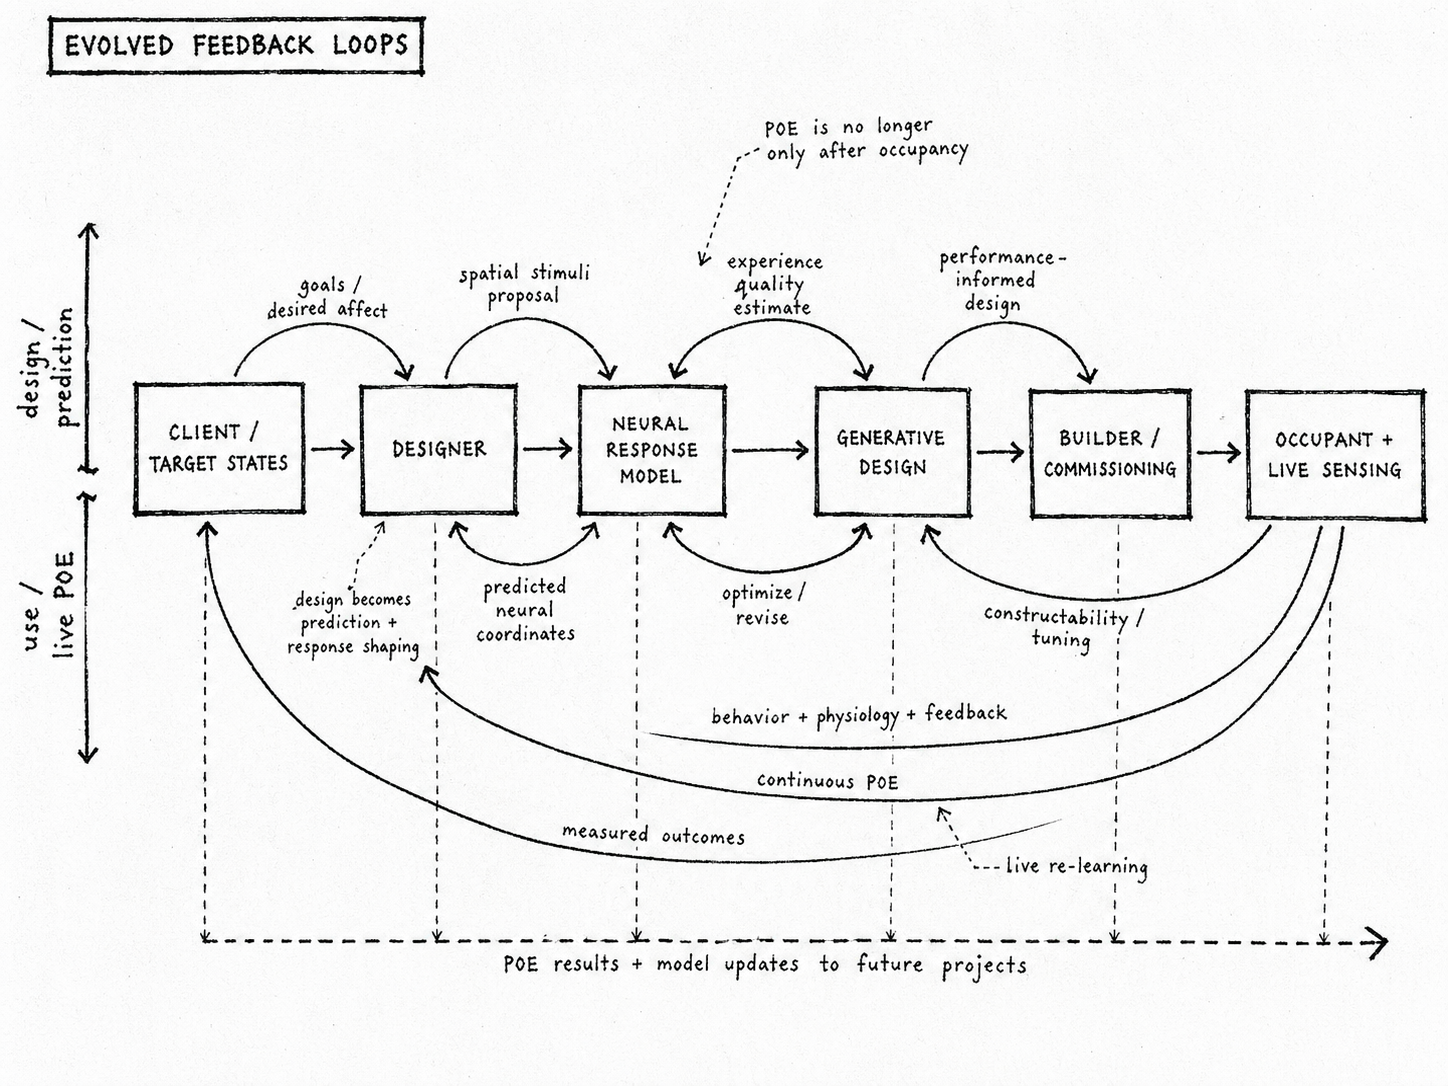
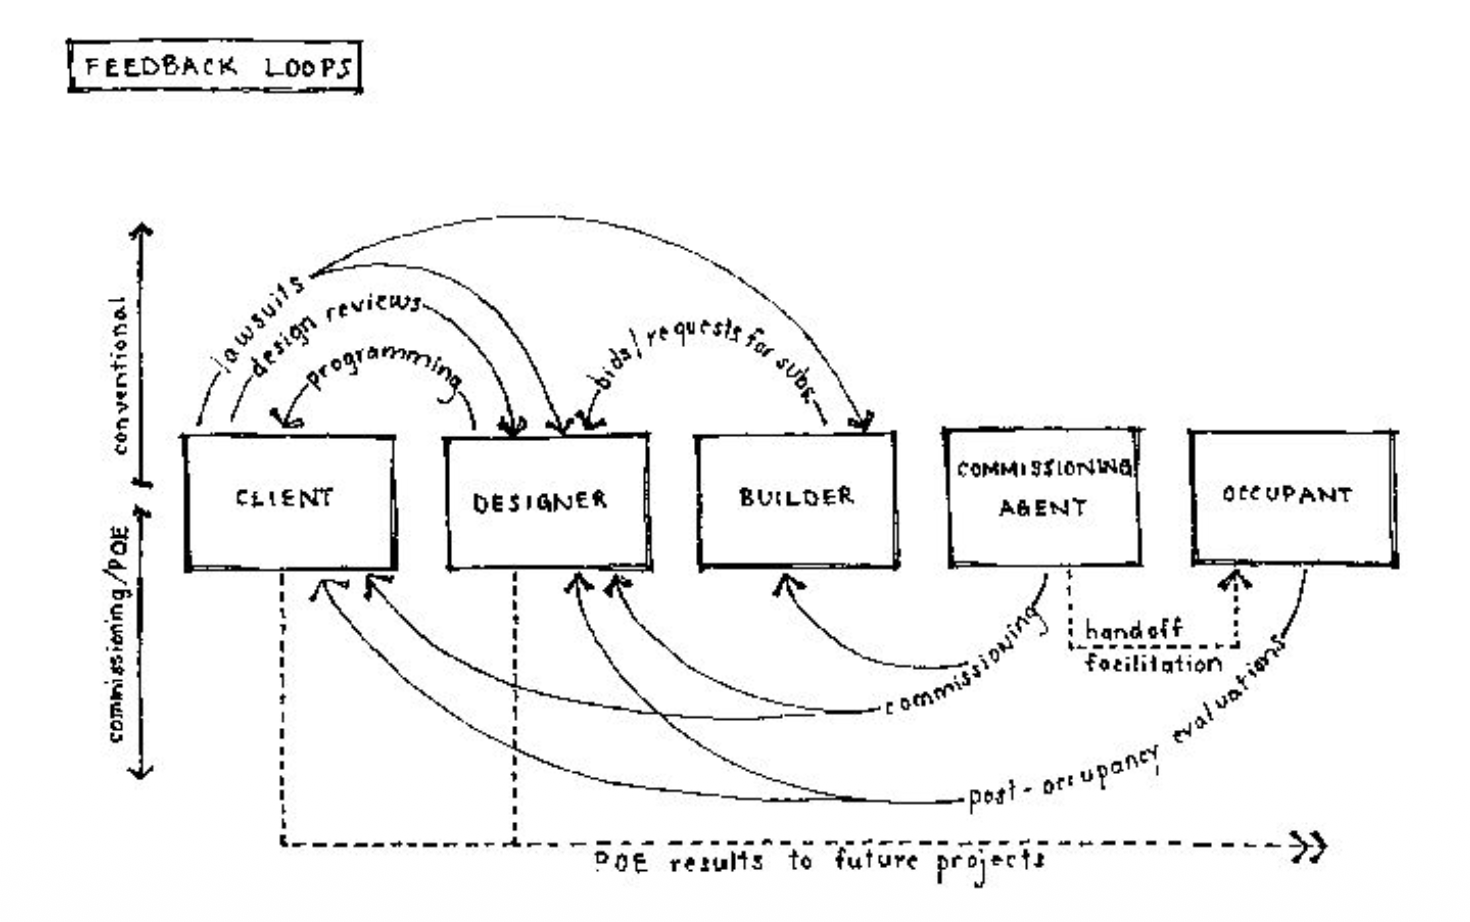
The contrast between these two diagrams marks the architectural stakes of the project. In a conventional design process, meaningful feedback often arrives late: after a building is commissioned, occupied, evaluated, and translated into lessons for future projects. The architect works with delayed evidence. Experience becomes knowledge only after a long interval of use, measurement, and institutional memory. Topology of Mind asks whether another process can be imagined: one in which desired affective states, predicted neural coordinates, generative spatial proposals, and live post-occupancy sensing are placed in a more continuous loop. This is not presented as a completed workflow, but as a speculative process model opened by the experiment.
Discussion: Limits and Open Proposal
The experiment does not prove that emotion can be computed from neural activity, nor that architecture can be deterministically generated from such a model. Its evidence is deliberately narrower. The data come from mice viewing visual stimuli, not from humans occupying architectural spaces or reporting emotional states. The analysis also works with selected brain regions rather than a complete account of perception, memory, body, environment, and affect.
The prediction results reflect this limit. Visual cortical regions show modest positive predictive structure, while CA1 and DG remain much weaker. In the encoding summary, CA1 has a mean Pearson correlation of approximately 0.13 and an R² near zero; DG has a mean Pearson correlation near zero and a negative R². This is consistent with their role in the project as region-specific, less stable structures rather than direct control variables for design. They are not evidence that a single neural coordinate can determine an emotional or spatial outcome.
For this reason, Topology of Mind should be read less as a deterministic design engine than as an experiment in legibility. It tests whether visual experience, neural activity, topological structure, and generative modeling can be placed into relation, and whether those relations can suggest another design process. In that process, computational models do not replace intuition or authorship. They become instruments for asking what can be inferred, what remains ambiguous, and where the designer must continue to interpret, select, and question the translation between feeling, data, and form.