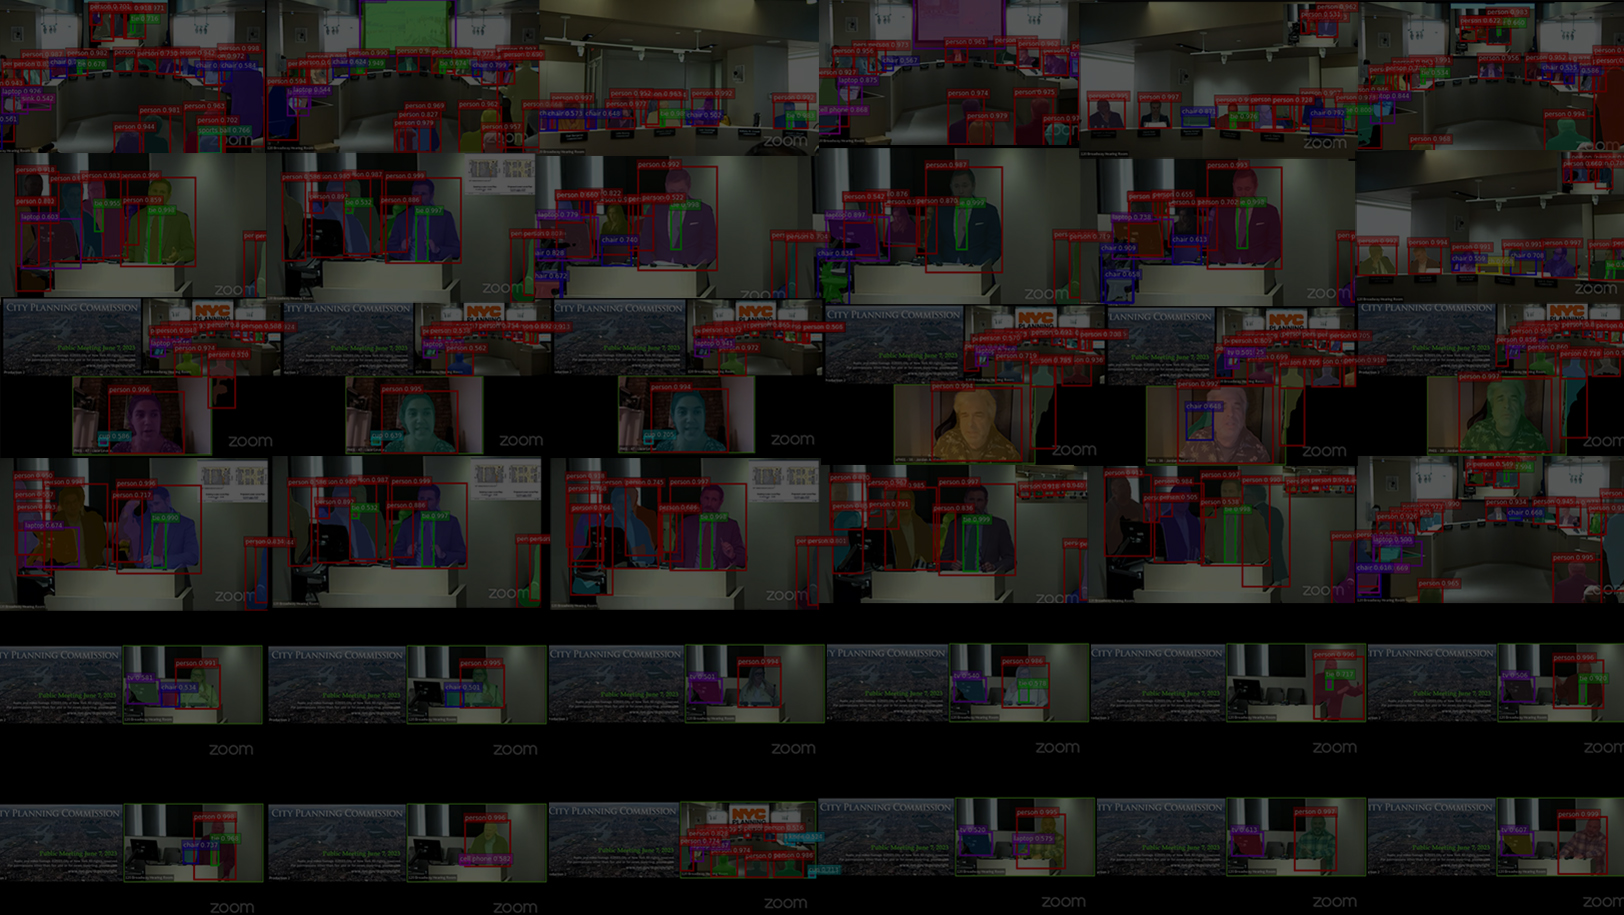
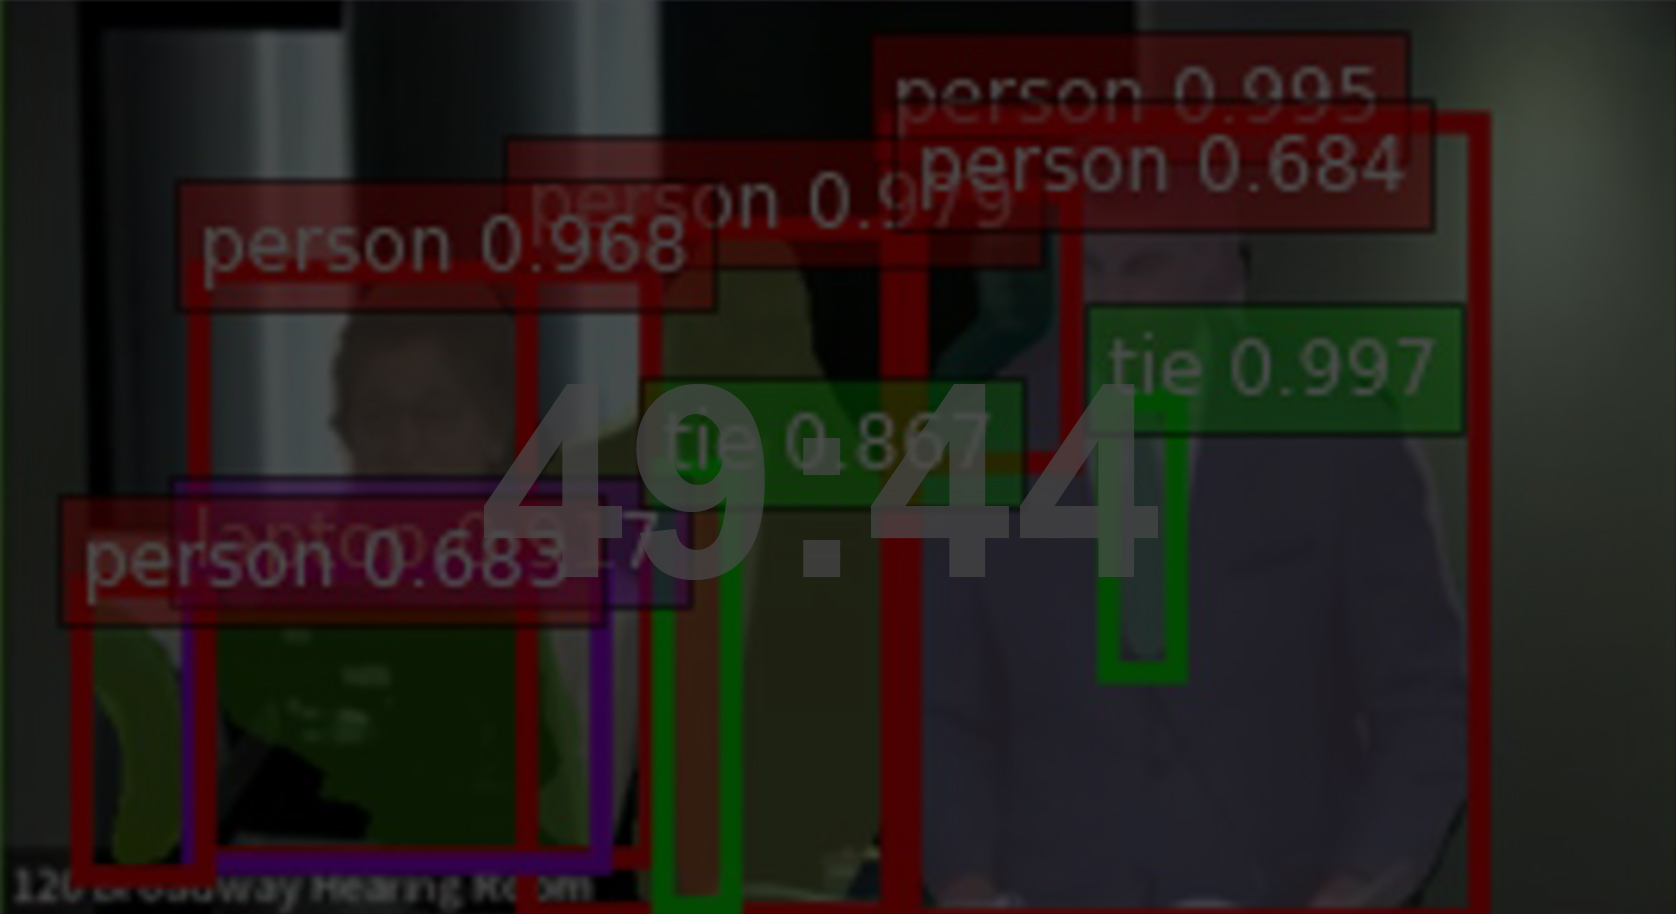
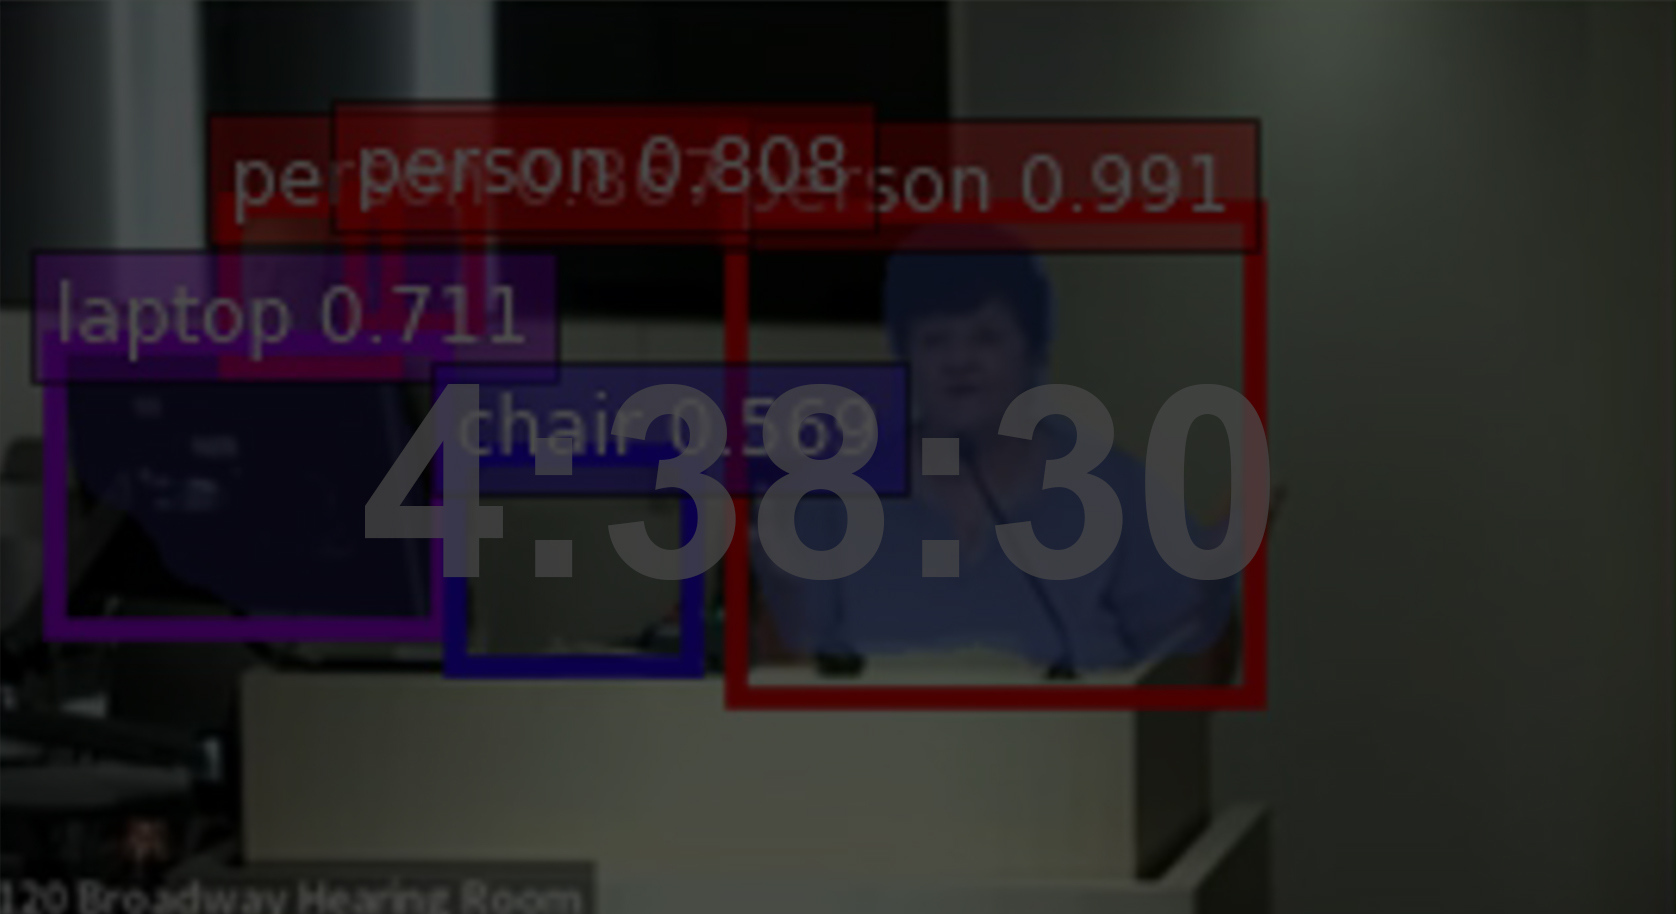
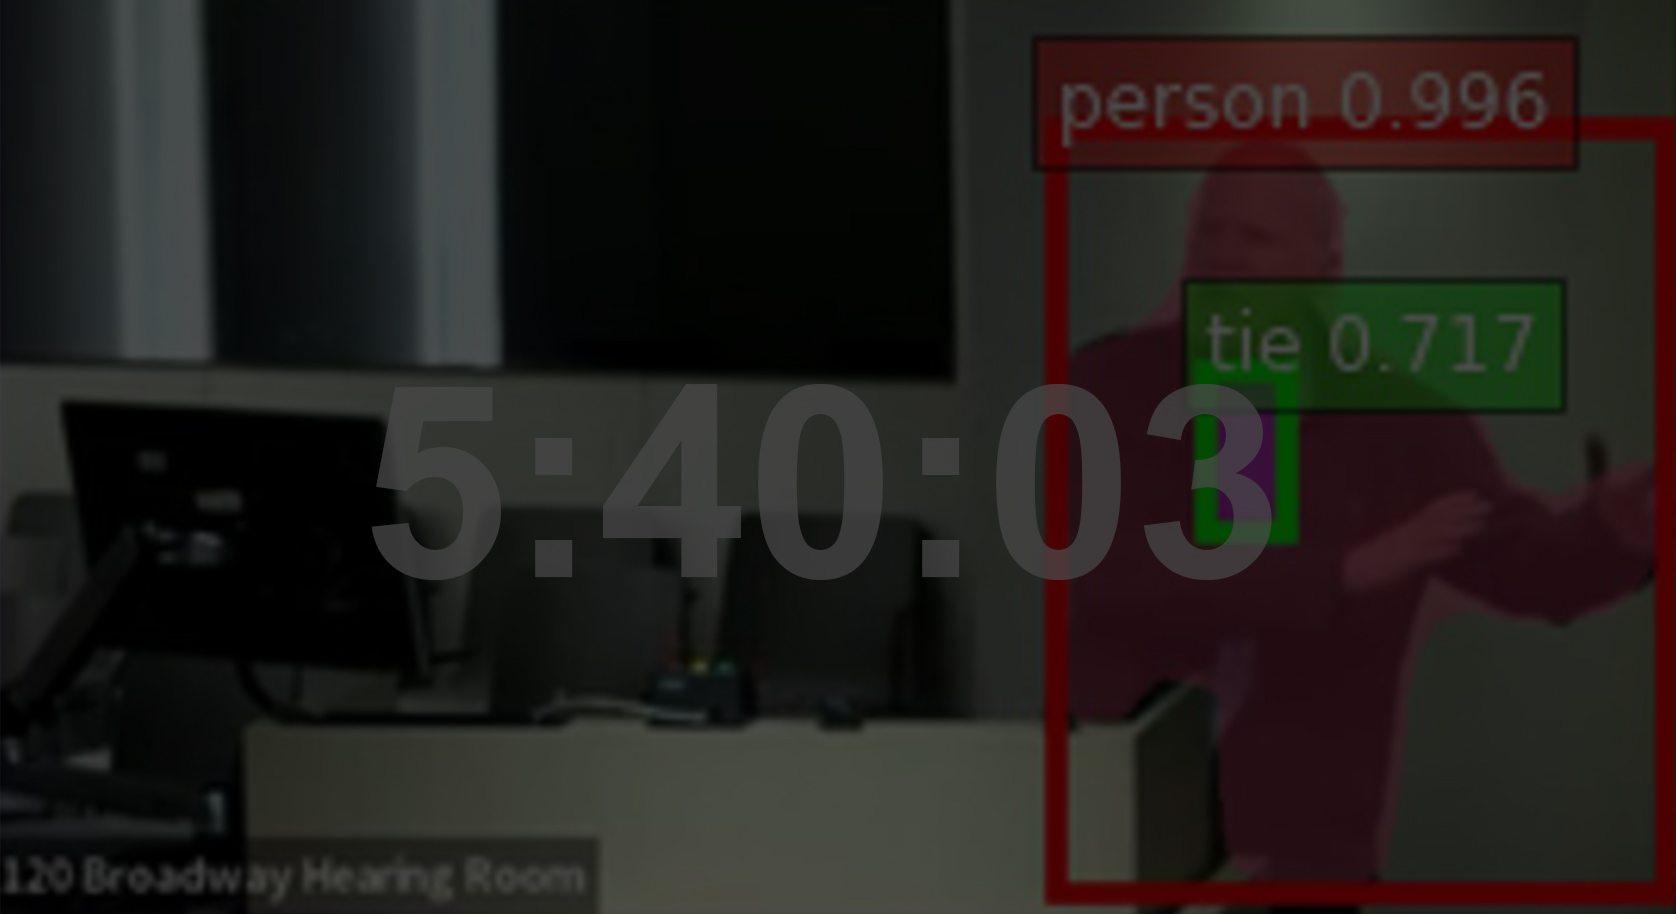
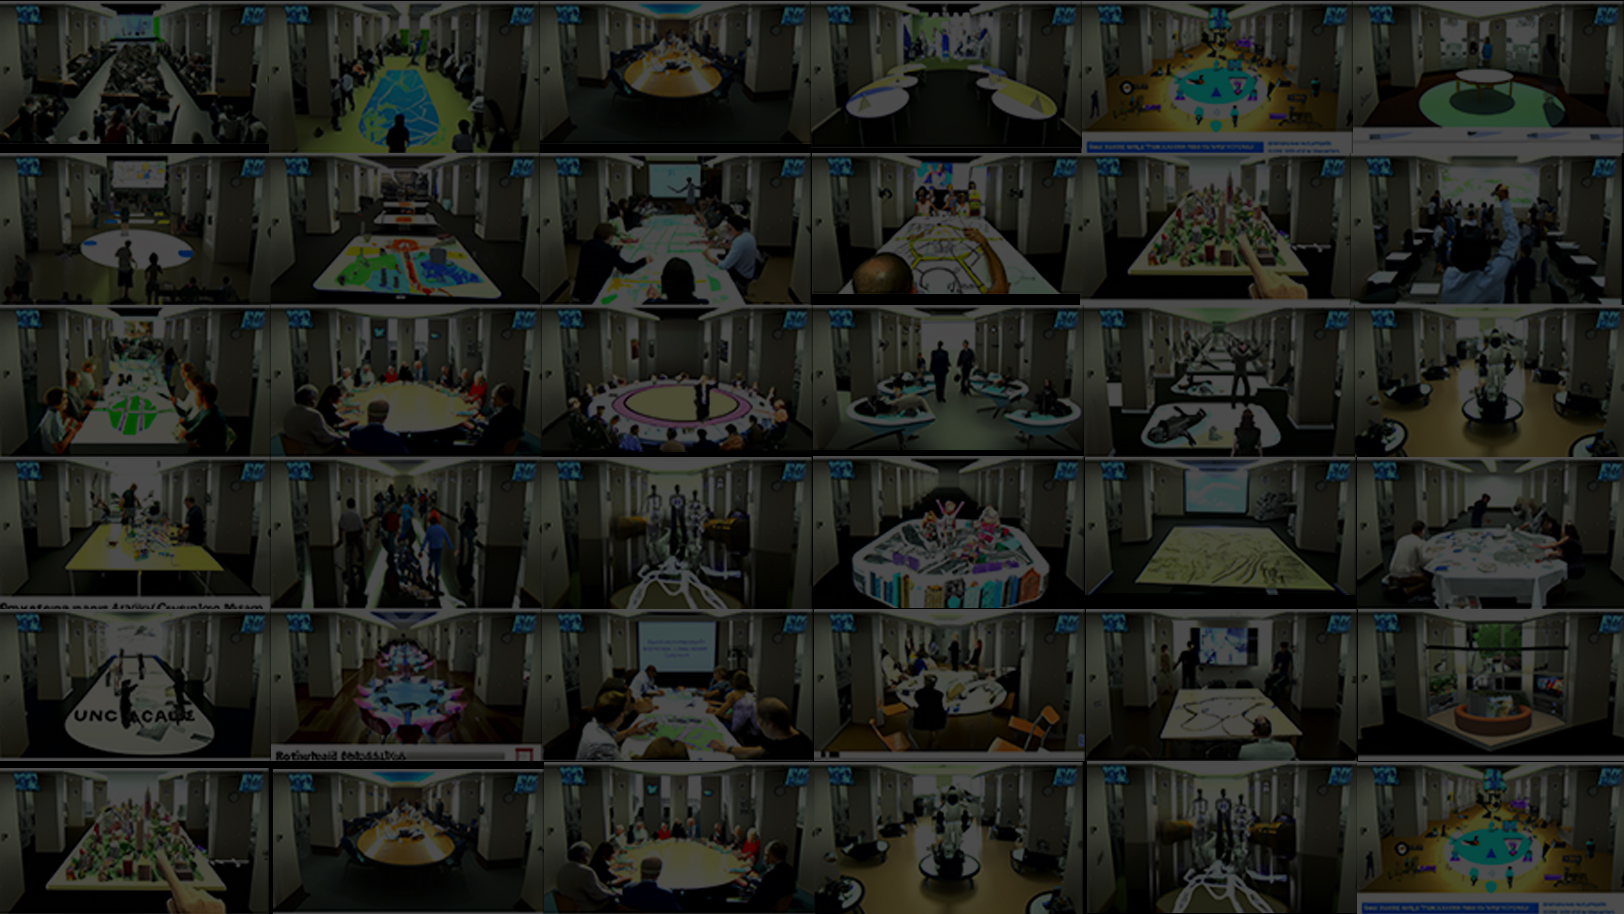
I'm driven by the potential of machine learning, computer vision, and data visualization in understanding urban human behaviors and perceptions. I've used computer vision to analyze New York City Planning Department's public meetings, gauging public participation. I also explored generative AI for enhancing meeting layouts. Another project involved creating AR plants that react to human facial expressions. Additionally, I've harnessed crowdsourced data to craft perception maps of New York City, integrating them with sky visibility and Citi Bike mobility data to delve into urban influences on human perceptions. Beyond these, I'm enthusiastic about HCI, interaction design, UX design, and tangible interfaces, aspiring to develop user interfaces that foster community engagement.
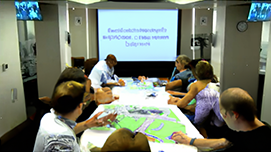
1. The average attendance during the meeting video was 12 individuals, peaking at 68. At the start, there were 30 attendees, composed of 10 commission members, 8 applicants, and a variable number from the general public.
2. The meeting was structured as follows: Opening and Introduction: 11.2%; Presentation by the Applicant(s): 37.1%; Question & Answer (Q&A) Session: 22.4%; Public Commentary: 19.7%;Conclusion and Summary: 9.5%;
3. The number of attendees dwindled over time. The public commentary segment was positioned towards the end. The initial part predominantly featured presentations from the 8 applicants about the project and their requests, while the commission members primarily engaged in the middle portion during the Q&A session.
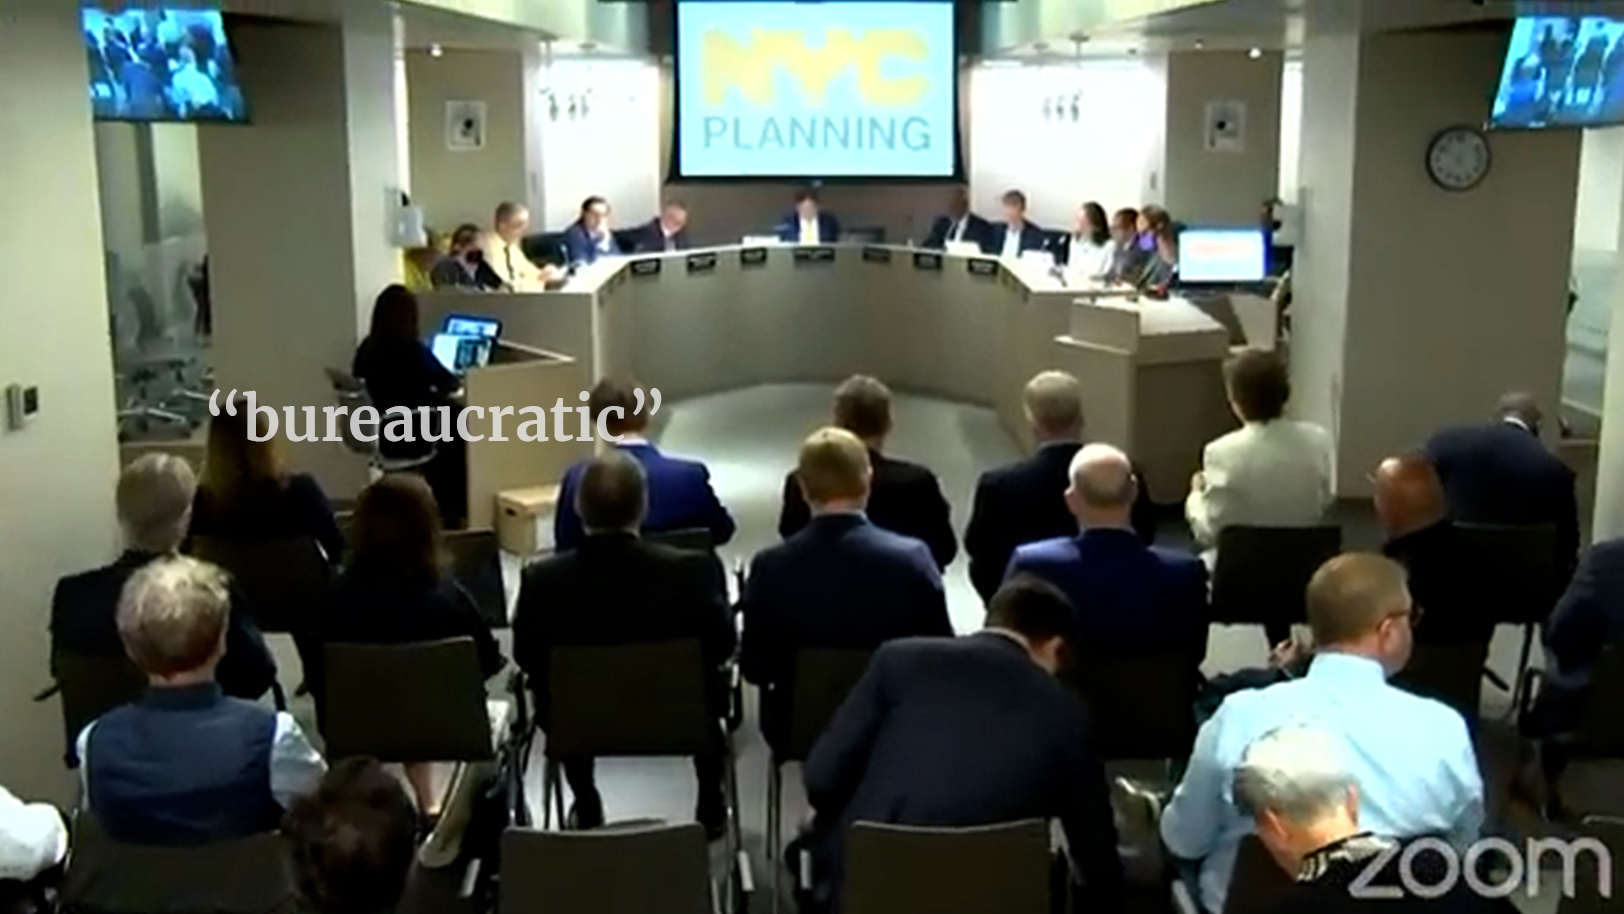
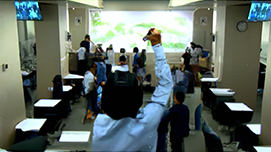
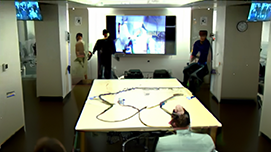
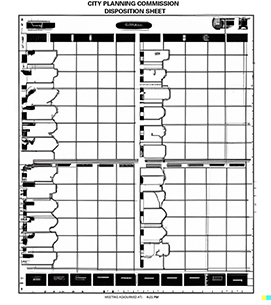
"BUREAUCRATIC VERSION"
1. The Commission and the public were separated by a layer of glass and a table, creating a physical and visual barrier.
2. The chairs around the conference table were neatly arranged, not easily movable or reconfigurable, limiting the flexibility of the space.
3. The internal sound system and technical equipment appeared outdated, hindering modern interaction and communication.
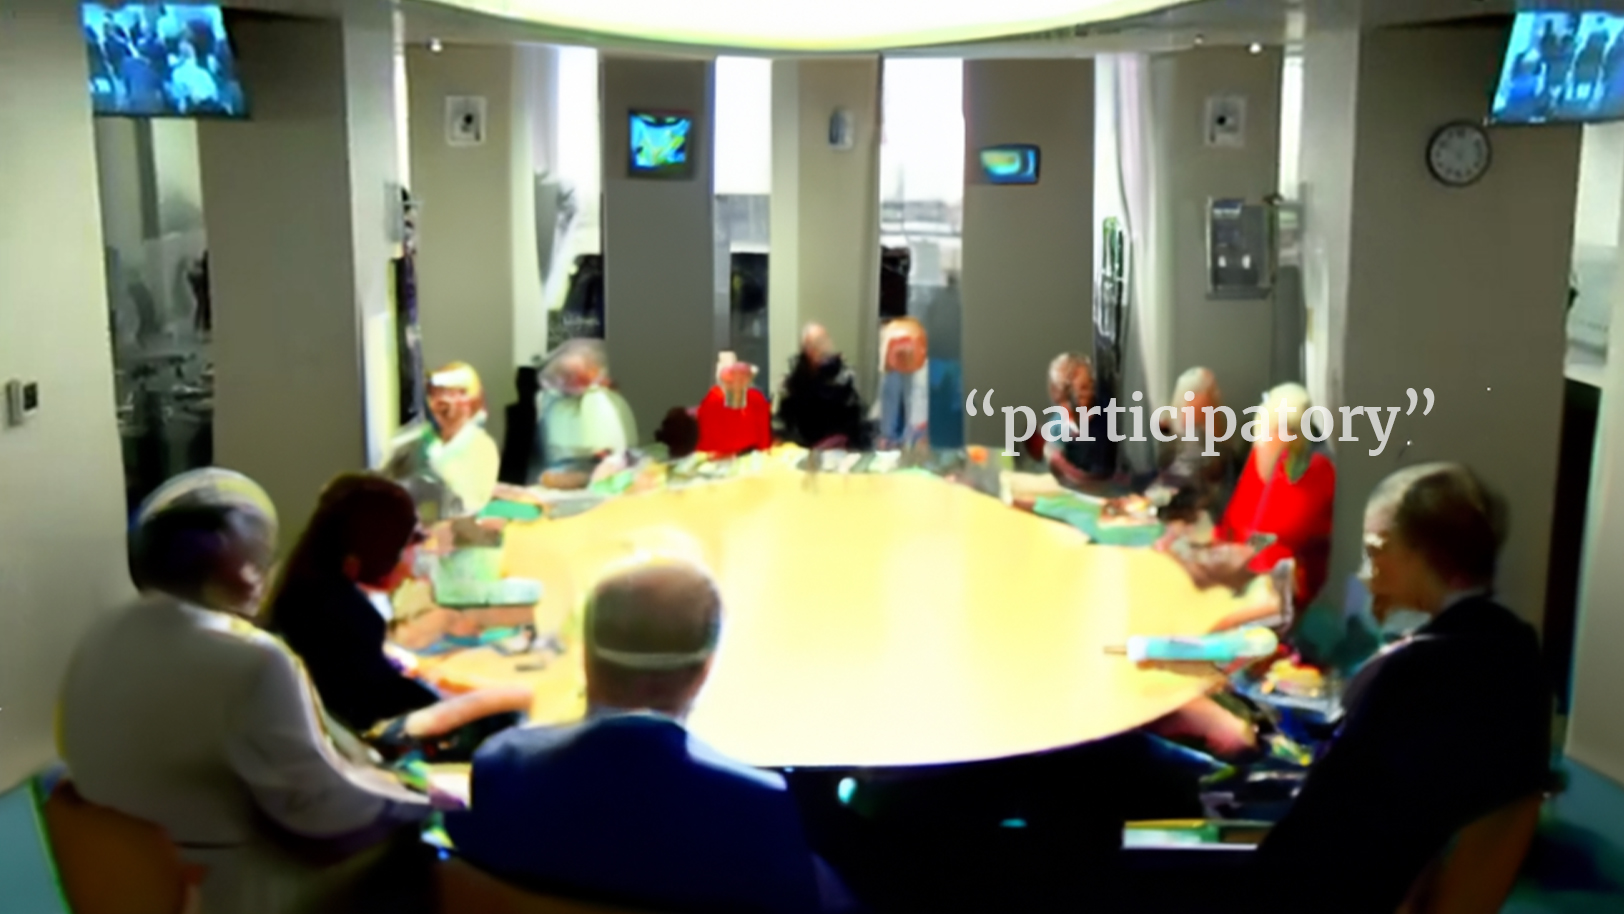
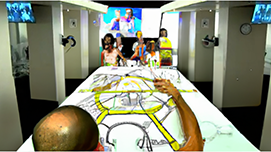
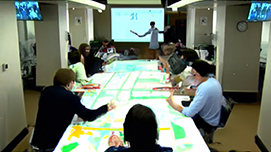
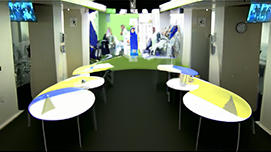
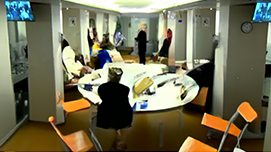
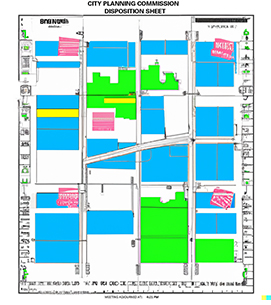
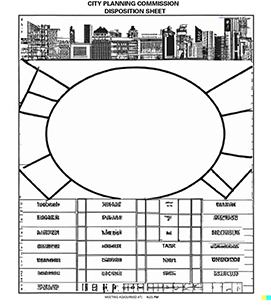
"PARTICIPATORY VERSION"
1. The boundary between the Commission and the public is blurred. The room features multiple smaller tables that promote group discussions, as well as round tables that foster inclusivity and equal participation.
2.Detailed maps of projects are displayed, on which the public can freely draw or mark, allowing them to visually express their opinions and suggestions.
3. The room is equipped with advanced interactive AR (Augmented Reality) and VR (Virtual Reality) tools. These technologies enable immersive presentations and allow participants to virtually explore project designs or city plans in real-time.
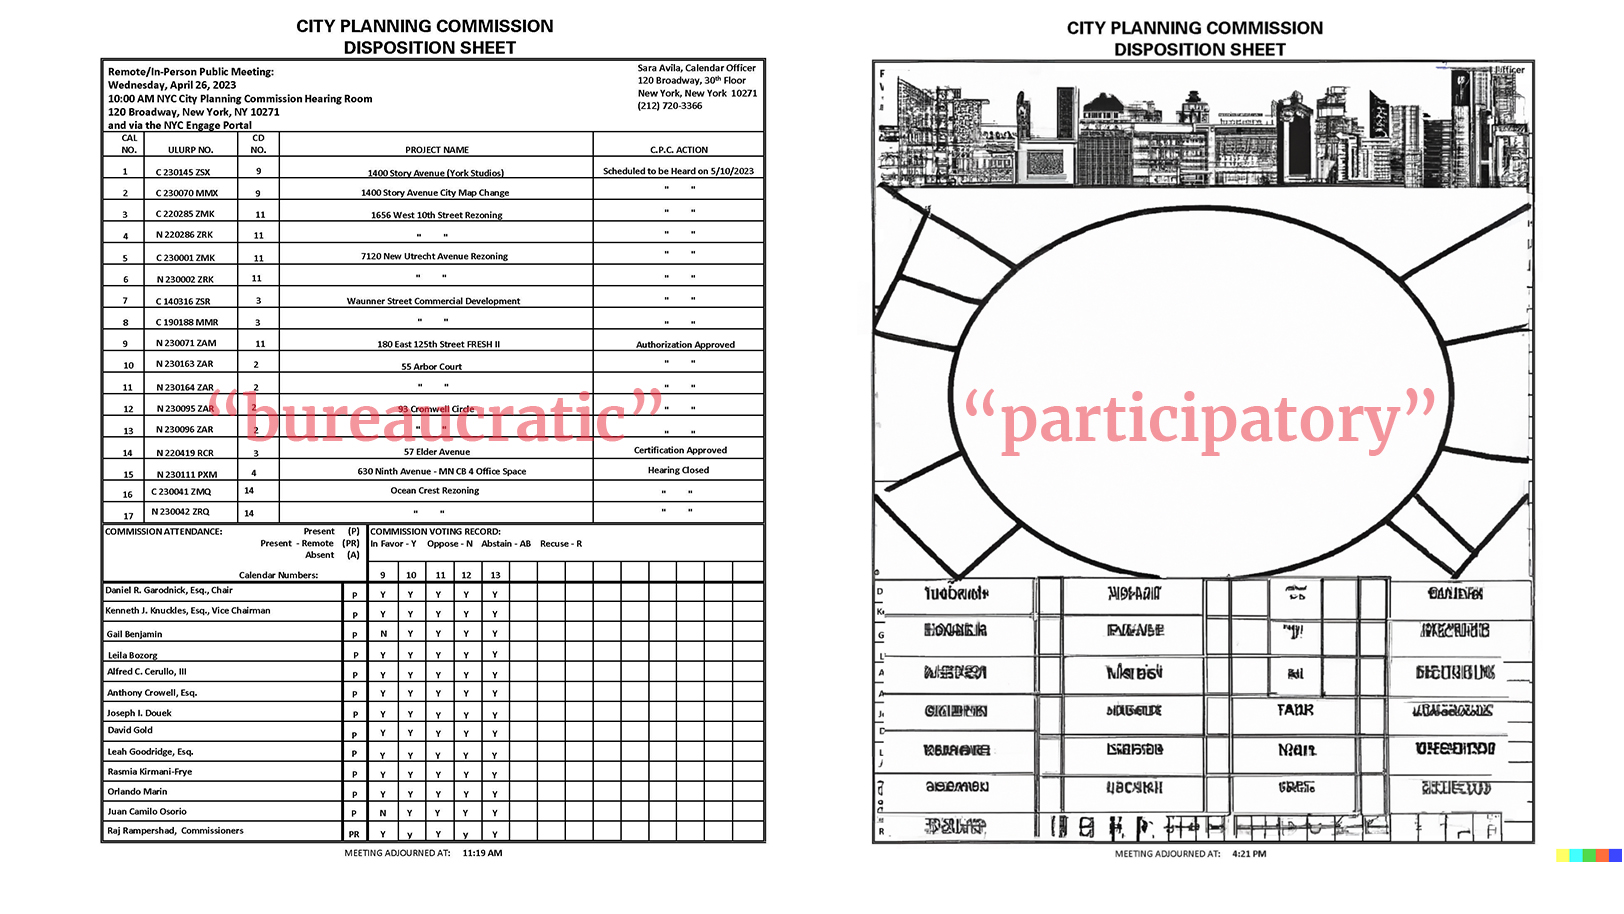
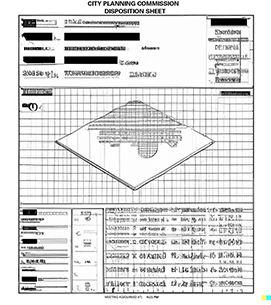
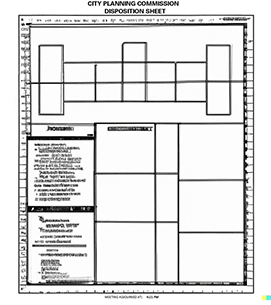
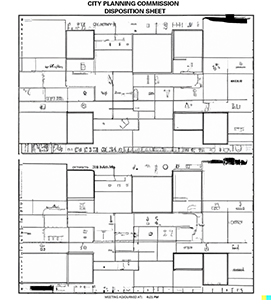
"BUREAUCRATIC VERSION"
1. It primarily encompassed information related to the topics discussed in the meeting, the attendance of the City Planning Commission, and the voting results.
2. The format was a formal table where each row had a uniform height.
3. It was text-heavy with minimal visual elements.
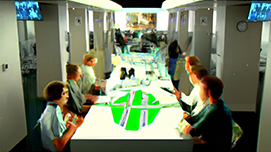
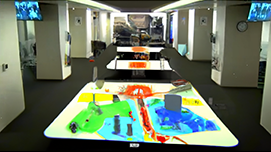
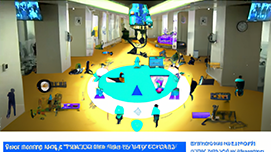
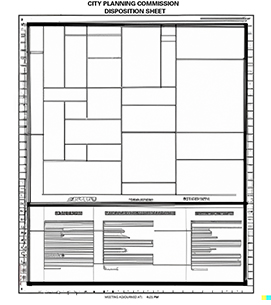
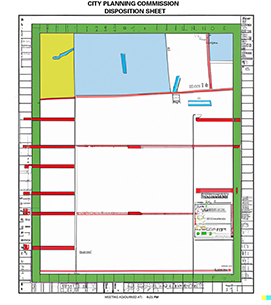
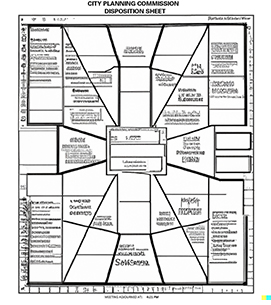
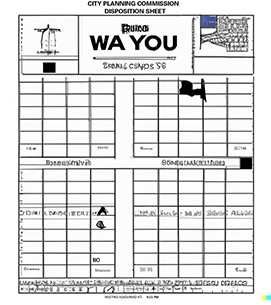
"PARTICIPATORY VERSION"
1. A more flexible format, moving beyond the confines of square grids.
2. Enhanced interactivity, introducing a board-game-like map of projects within the sheet and adding spaces for public feedback.
3. Improved readability with an abundance of data visualizations, including pie charts and icons, all rendered in vibrant colors.

Due to the lockdowns and isolations caused by the pandemic, people are forced to work at home for extended periods, affecting many people's mental health. Moreover, as interpersonal interactions decrease, many people may overlook their emotional changes, exacerbating emotional issues. To address this, we designed an application using Augmented Reality (AR) and the DeepFace facial expression recognition algorithm. Through user interaction with a virtual plant that mirrors their emotional state, users are prompted to be more attuned to their feelings. For instance, a withering plant signifies possible unhappiness, nudging users to care for their mental health. In the development of this application, we mainly used the DeepFace Python library for facial expression recognition and analysis. At the same time, to better showcase and test this application, we also created a video demonstrating how people can interact with it on various devices (such as smartphones, tablets, projectors), and experience the changes in the model and textures. Overall, we hope that through this application, high technology can help users better understand and care for their own psychological state, thereby improving the quality of life and work efficiency. This context has become increasingly relevant in the wake of the global pandemic, as more people work from home and face the challenges of isolation and mental health.
